Thai vs Immigrants from Sri Lanka Single Female Poverty
COMPARE
Thai
Immigrants from Sri Lanka
Single Female Poverty
Single Female Poverty Comparison
Thais
Immigrants from Sri Lanka
17.3%
SINGLE FEMALE POVERTY
100.0/ 100
METRIC RATING
7th/ 347
METRIC RANK
18.6%
SINGLE FEMALE POVERTY
99.9/ 100
METRIC RATING
32nd/ 347
METRIC RANK
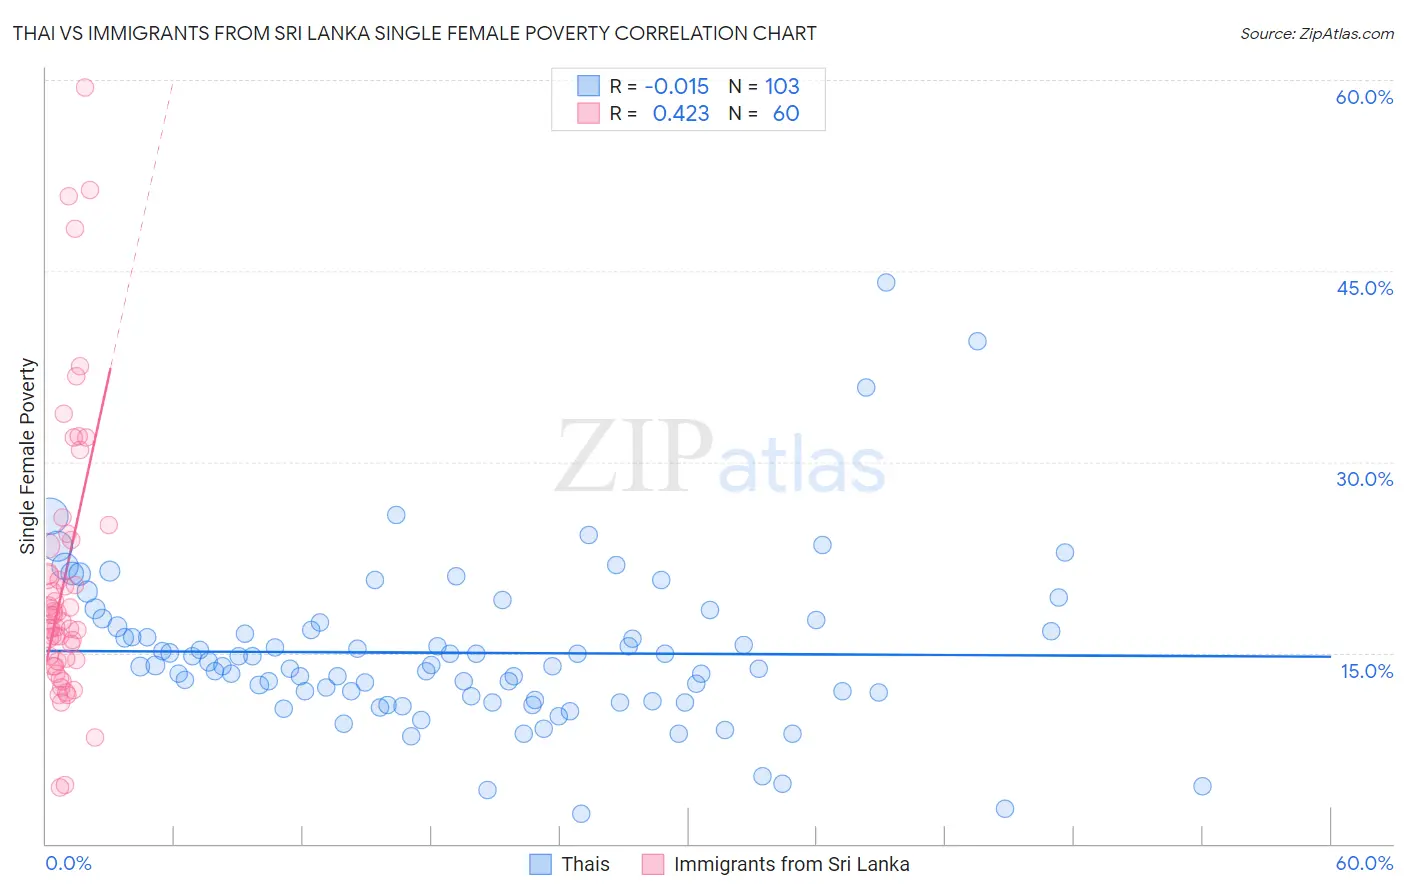
Thai vs Immigrants from Sri Lanka Single Female Poverty Correlation Chart
The statistical analysis conducted on geographies consisting of 465,874,007 people shows no correlation between the proportion of Thais and poverty level among single females in the United States with a correlation coefficient (R) of -0.015 and weighted average of 17.3%. Similarly, the statistical analysis conducted on geographies consisting of 148,613,920 people shows a moderate positive correlation between the proportion of Immigrants from Sri Lanka and poverty level among single females in the United States with a correlation coefficient (R) of 0.423 and weighted average of 18.6%, a difference of 7.4%.
Single Female Poverty Correlation Summary
| Measurement | Thai | Immigrants from Sri Lanka |
| Minimum | 2.4% | 4.4% |
| Maximum | 44.0% | 59.4% |
| Range | 41.7% | 55.0% |
| Mean | 15.0% | 20.8% |
| Median | 13.9% | 17.7% |
| Interquartile 25% (IQ1) | 11.3% | 14.4% |
| Interquartile 75% (IQ3) | 17.1% | 23.6% |
| Interquartile Range (IQR) | 5.8% | 9.3% |
| Standard Deviation (Sample) | 6.4% | 11.0% |
| Standard Deviation (Population) | 6.4% | 11.0% |
Similar Demographics by Single Female Poverty
Demographics Similar to Thais by Single Female Poverty
In terms of single female poverty, the demographic groups most similar to Thais are Immigrants from Iran (17.5%, a difference of 0.99%), Filipino (17.0%, a difference of 1.7%), Assyrian/Chaldean/Syriac (17.0%, a difference of 1.9%), Bhutanese (17.7%, a difference of 2.4%), and Immigrants from India (16.8%, a difference of 2.8%).
| Demographics | Rating | Rank | Single Female Poverty |
| Chinese | 100.0 /100 | #1 | Exceptional 16.1% |
| Immigrants | Taiwan | 100.0 /100 | #2 | Exceptional 16.4% |
| Immigrants | Hong Kong | 100.0 /100 | #3 | Exceptional 16.5% |
| Immigrants | India | 100.0 /100 | #4 | Exceptional 16.8% |
| Assyrians/Chaldeans/Syriacs | 100.0 /100 | #5 | Exceptional 17.0% |
| Filipinos | 100.0 /100 | #6 | Exceptional 17.0% |
| Thais | 100.0 /100 | #7 | Exceptional 17.3% |
| Immigrants | Iran | 100.0 /100 | #8 | Exceptional 17.5% |
| Bhutanese | 100.0 /100 | #9 | Exceptional 17.7% |
| Immigrants | Ireland | 100.0 /100 | #10 | Exceptional 17.8% |
| Immigrants | Lithuania | 100.0 /100 | #11 | Exceptional 17.8% |
| Immigrants | South Central Asia | 100.0 /100 | #12 | Exceptional 17.8% |
| Immigrants | Bolivia | 100.0 /100 | #13 | Exceptional 17.8% |
| Bolivians | 100.0 /100 | #14 | Exceptional 17.9% |
| Indians (Asian) | 100.0 /100 | #15 | Exceptional 17.9% |
Demographics Similar to Immigrants from Sri Lanka by Single Female Poverty
In terms of single female poverty, the demographic groups most similar to Immigrants from Sri Lanka are Immigrants from Philippines (18.6%, a difference of 0.060%), Immigrants from Asia (18.6%, a difference of 0.090%), Immigrants from North Macedonia (18.5%, a difference of 0.14%), Korean (18.6%, a difference of 0.25%), and Immigrants from Poland (18.5%, a difference of 0.29%).
| Demographics | Rating | Rank | Single Female Poverty |
| Immigrants | Singapore | 100.0 /100 | #25 | Exceptional 18.3% |
| Immigrants | Israel | 100.0 /100 | #26 | Exceptional 18.3% |
| Immigrants | Pakistan | 100.0 /100 | #27 | Exceptional 18.4% |
| Immigrants | Moldova | 100.0 /100 | #28 | Exceptional 18.5% |
| Immigrants | Poland | 100.0 /100 | #29 | Exceptional 18.5% |
| Immigrants | North Macedonia | 99.9 /100 | #30 | Exceptional 18.5% |
| Immigrants | Asia | 99.9 /100 | #31 | Exceptional 18.6% |
| Immigrants | Sri Lanka | 99.9 /100 | #32 | Exceptional 18.6% |
| Immigrants | Philippines | 99.9 /100 | #33 | Exceptional 18.6% |
| Koreans | 99.9 /100 | #34 | Exceptional 18.6% |
| Immigrants | Japan | 99.9 /100 | #35 | Exceptional 18.6% |
| Turks | 99.9 /100 | #36 | Exceptional 18.7% |
| Immigrants | Armenia | 99.9 /100 | #37 | Exceptional 18.7% |
| Tongans | 99.9 /100 | #38 | Exceptional 18.8% |
| Bulgarians | 99.9 /100 | #39 | Exceptional 18.8% |