Syrian vs Immigrants from Egypt Single Female Poverty
COMPARE
Syrian
Immigrants from Egypt
Single Female Poverty
Single Female Poverty Comparison
Syrians
Immigrants from Egypt
20.3%
SINGLE FEMALE POVERTY
90.4/ 100
METRIC RATING
140th/ 347
METRIC RANK
19.2%
SINGLE FEMALE POVERTY
99.6/ 100
METRIC RATING
67th/ 347
METRIC RANK
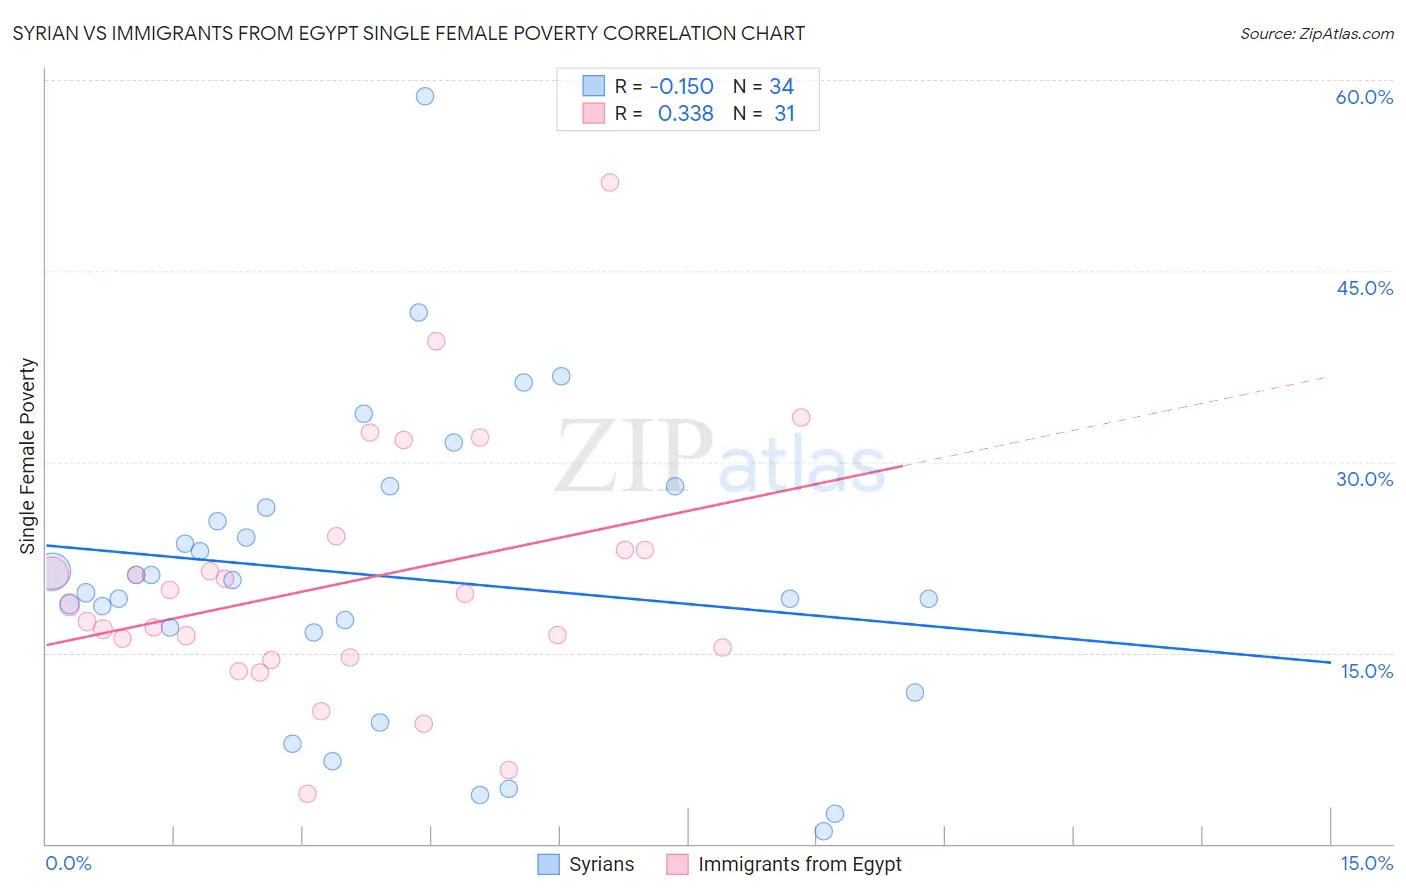
Syrian vs Immigrants from Egypt Single Female Poverty Correlation Chart
The statistical analysis conducted on geographies consisting of 263,006,420 people shows a poor negative correlation between the proportion of Syrians and poverty level among single females in the United States with a correlation coefficient (R) of -0.150 and weighted average of 20.3%. Similarly, the statistical analysis conducted on geographies consisting of 243,038,717 people shows a mild positive correlation between the proportion of Immigrants from Egypt and poverty level among single females in the United States with a correlation coefficient (R) of 0.338 and weighted average of 19.2%, a difference of 5.4%.
Single Female Poverty Correlation Summary
| Measurement | Syrian | Immigrants from Egypt |
| Minimum | 0.97% | 3.9% |
| Maximum | 58.7% | 52.0% |
| Range | 57.7% | 48.1% |
| Mean | 21.0% | 20.5% |
| Median | 20.2% | 18.7% |
| Interquartile 25% (IQ1) | 16.6% | 14.6% |
| Interquartile 75% (IQ3) | 26.4% | 23.1% |
| Interquartile Range (IQR) | 9.8% | 8.4% |
| Standard Deviation (Sample) | 12.0% | 9.9% |
| Standard Deviation (Population) | 11.8% | 9.7% |
Similar Demographics by Single Female Poverty
Demographics Similar to Syrians by Single Female Poverty
In terms of single female poverty, the demographic groups most similar to Syrians are Slovene (20.3%, a difference of 0.010%), Immigrants from Kuwait (20.3%, a difference of 0.010%), Immigrants from Nepal (20.3%, a difference of 0.050%), Immigrants from North America (20.3%, a difference of 0.15%), and Immigrants from Iraq (20.2%, a difference of 0.16%).
| Demographics | Rating | Rank | Single Female Poverty |
| Immigrants | England | 91.9 /100 | #133 | Exceptional 20.2% |
| Immigrants | Venezuela | 91.5 /100 | #134 | Exceptional 20.2% |
| Immigrants | Iraq | 91.2 /100 | #135 | Exceptional 20.2% |
| Immigrants | Canada | 91.2 /100 | #136 | Exceptional 20.2% |
| Immigrants | Nepal | 90.6 /100 | #137 | Exceptional 20.3% |
| Slovenes | 90.5 /100 | #138 | Exceptional 20.3% |
| Immigrants | Kuwait | 90.4 /100 | #139 | Exceptional 20.3% |
| Syrians | 90.4 /100 | #140 | Exceptional 20.3% |
| Immigrants | North America | 89.5 /100 | #141 | Excellent 20.3% |
| Immigrants | Uganda | 89.1 /100 | #142 | Excellent 20.3% |
| Australians | 88.4 /100 | #143 | Excellent 20.3% |
| Immigrants | Uzbekistan | 88.3 /100 | #144 | Excellent 20.3% |
| Austrians | 85.8 /100 | #145 | Excellent 20.4% |
| Venezuelans | 85.5 /100 | #146 | Excellent 20.4% |
| South Africans | 85.3 /100 | #147 | Excellent 20.4% |
Demographics Similar to Immigrants from Egypt by Single Female Poverty
In terms of single female poverty, the demographic groups most similar to Immigrants from Egypt are Palestinian (19.2%, a difference of 0.040%), Laotian (19.3%, a difference of 0.040%), Cypriot (19.2%, a difference of 0.060%), Immigrants from Europe (19.2%, a difference of 0.080%), and Immigrants from Northern Europe (19.2%, a difference of 0.090%).
| Demographics | Rating | Rank | Single Female Poverty |
| Russians | 99.6 /100 | #60 | Exceptional 19.2% |
| Cambodians | 99.6 /100 | #61 | Exceptional 19.2% |
| Lithuanians | 99.6 /100 | #62 | Exceptional 19.2% |
| Immigrants | Northern Europe | 99.6 /100 | #63 | Exceptional 19.2% |
| Immigrants | Europe | 99.6 /100 | #64 | Exceptional 19.2% |
| Cypriots | 99.6 /100 | #65 | Exceptional 19.2% |
| Palestinians | 99.6 /100 | #66 | Exceptional 19.2% |
| Immigrants | Egypt | 99.6 /100 | #67 | Exceptional 19.2% |
| Laotians | 99.5 /100 | #68 | Exceptional 19.3% |
| Paraguayans | 99.5 /100 | #69 | Exceptional 19.3% |
| Immigrants | Jordan | 99.4 /100 | #70 | Exceptional 19.3% |
| Immigrants | South Eastern Asia | 99.4 /100 | #71 | Exceptional 19.3% |
| Immigrants | Latvia | 99.4 /100 | #72 | Exceptional 19.3% |
| Immigrants | Peru | 99.4 /100 | #73 | Exceptional 19.3% |
| Immigrants | Belarus | 99.4 /100 | #74 | Exceptional 19.3% |