Syrian vs Immigrants from Panama Single Female Poverty
COMPARE
Syrian
Immigrants from Panama
Single Female Poverty
Single Female Poverty Comparison
Syrians
Immigrants from Panama
20.3%
SINGLE FEMALE POVERTY
90.4/ 100
METRIC RATING
140th/ 347
METRIC RANK
21.6%
SINGLE FEMALE POVERTY
14.4/ 100
METRIC RATING
210th/ 347
METRIC RANK
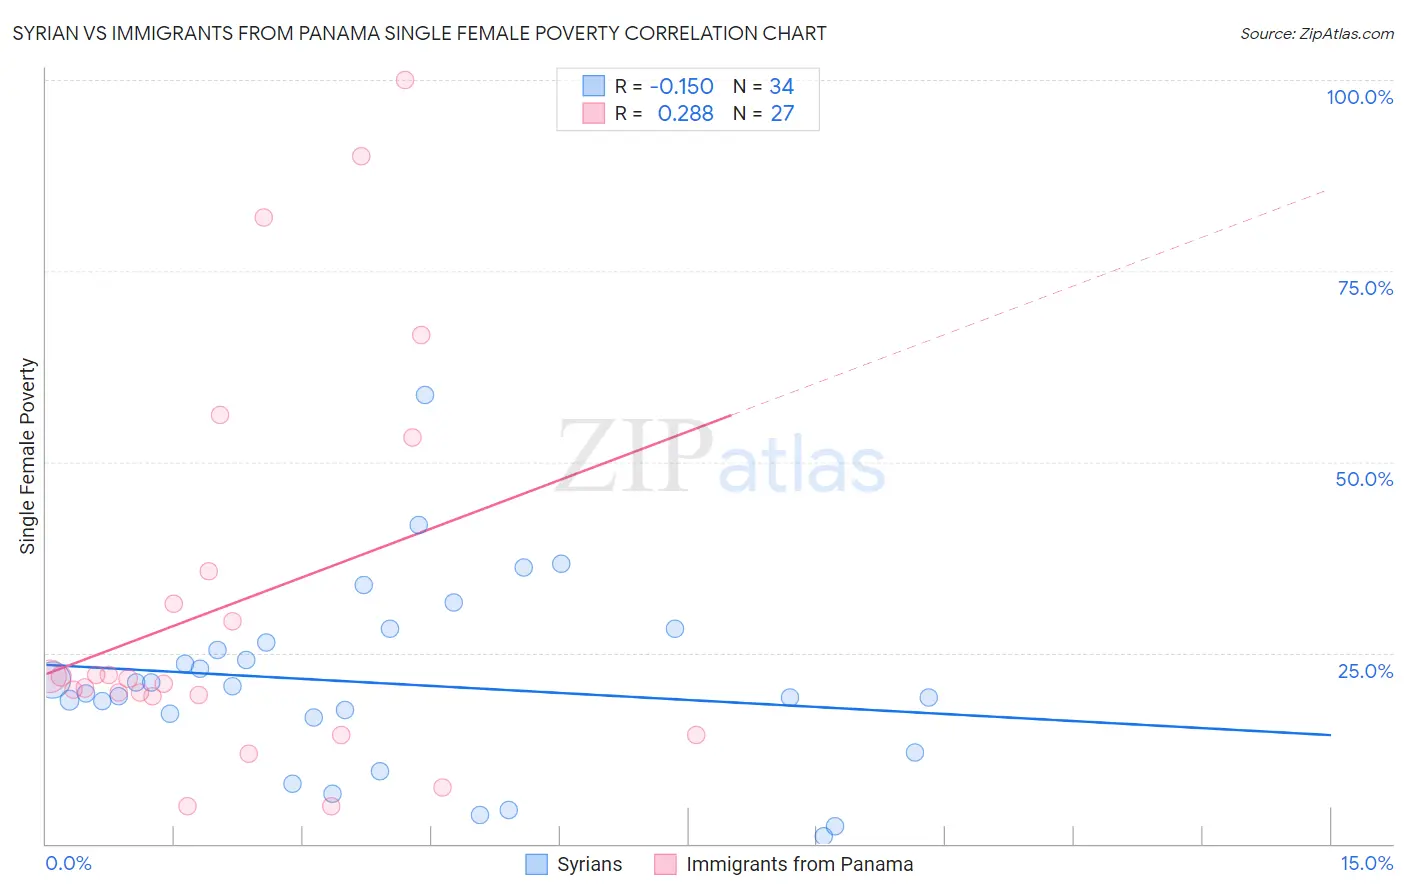
Syrian vs Immigrants from Panama Single Female Poverty Correlation Chart
The statistical analysis conducted on geographies consisting of 263,006,420 people shows a poor negative correlation between the proportion of Syrians and poverty level among single females in the United States with a correlation coefficient (R) of -0.150 and weighted average of 20.3%. Similarly, the statistical analysis conducted on geographies consisting of 219,865,488 people shows a weak positive correlation between the proportion of Immigrants from Panama and poverty level among single females in the United States with a correlation coefficient (R) of 0.288 and weighted average of 21.6%, a difference of 6.5%.
Single Female Poverty Correlation Summary
| Measurement | Syrian | Immigrants from Panama |
| Minimum | 0.97% | 4.9% |
| Maximum | 58.7% | 100.0% |
| Range | 57.7% | 95.1% |
| Mean | 21.0% | 31.5% |
| Median | 20.2% | 21.6% |
| Interquartile 25% (IQ1) | 16.6% | 19.3% |
| Interquartile 75% (IQ3) | 26.4% | 35.7% |
| Interquartile Range (IQR) | 9.8% | 16.4% |
| Standard Deviation (Sample) | 12.0% | 25.8% |
| Standard Deviation (Population) | 11.8% | 25.4% |
Similar Demographics by Single Female Poverty
Demographics Similar to Syrians by Single Female Poverty
In terms of single female poverty, the demographic groups most similar to Syrians are Slovene (20.3%, a difference of 0.010%), Immigrants from Kuwait (20.3%, a difference of 0.010%), Immigrants from Nepal (20.3%, a difference of 0.050%), Immigrants from North America (20.3%, a difference of 0.15%), and Immigrants from Iraq (20.2%, a difference of 0.16%).
| Demographics | Rating | Rank | Single Female Poverty |
| Immigrants | England | 91.9 /100 | #133 | Exceptional 20.2% |
| Immigrants | Venezuela | 91.5 /100 | #134 | Exceptional 20.2% |
| Immigrants | Iraq | 91.2 /100 | #135 | Exceptional 20.2% |
| Immigrants | Canada | 91.2 /100 | #136 | Exceptional 20.2% |
| Immigrants | Nepal | 90.6 /100 | #137 | Exceptional 20.3% |
| Slovenes | 90.5 /100 | #138 | Exceptional 20.3% |
| Immigrants | Kuwait | 90.4 /100 | #139 | Exceptional 20.3% |
| Syrians | 90.4 /100 | #140 | Exceptional 20.3% |
| Immigrants | North America | 89.5 /100 | #141 | Excellent 20.3% |
| Immigrants | Uganda | 89.1 /100 | #142 | Excellent 20.3% |
| Australians | 88.4 /100 | #143 | Excellent 20.3% |
| Immigrants | Uzbekistan | 88.3 /100 | #144 | Excellent 20.3% |
| Austrians | 85.8 /100 | #145 | Excellent 20.4% |
| Venezuelans | 85.5 /100 | #146 | Excellent 20.4% |
| South Africans | 85.3 /100 | #147 | Excellent 20.4% |
Demographics Similar to Immigrants from Panama by Single Female Poverty
In terms of single female poverty, the demographic groups most similar to Immigrants from Panama are Icelander (21.6%, a difference of 0.040%), Jamaican (21.6%, a difference of 0.050%), Guamanian/Chamorro (21.6%, a difference of 0.080%), Immigrants from Eastern Africa (21.6%, a difference of 0.090%), and Haitian (21.6%, a difference of 0.12%).
| Demographics | Rating | Rank | Single Female Poverty |
| Immigrants | Haiti | 18.8 /100 | #203 | Poor 21.5% |
| Immigrants | Africa | 16.7 /100 | #204 | Poor 21.5% |
| Finns | 16.2 /100 | #205 | Poor 21.5% |
| Belgians | 16.1 /100 | #206 | Poor 21.5% |
| Ghanaians | 15.7 /100 | #207 | Poor 21.6% |
| Haitians | 15.4 /100 | #208 | Poor 21.6% |
| Immigrants | Eastern Africa | 15.1 /100 | #209 | Poor 21.6% |
| Immigrants | Panama | 14.4 /100 | #210 | Poor 21.6% |
| Icelanders | 14.0 /100 | #211 | Poor 21.6% |
| Jamaicans | 14.0 /100 | #212 | Poor 21.6% |
| Guamanians/Chamorros | 13.7 /100 | #213 | Poor 21.6% |
| Immigrants | Nicaragua | 13.3 /100 | #214 | Poor 21.6% |
| Ecuadorians | 12.3 /100 | #215 | Poor 21.6% |
| Immigrants | Barbados | 12.2 /100 | #216 | Poor 21.7% |
| Immigrants | St. Vincent and the Grenadines | 11.7 /100 | #217 | Poor 21.7% |