Swiss vs Lumbee Single Male Poverty
COMPARE
Swiss
Lumbee
Single Male Poverty
Single Male Poverty Comparison
Swiss
Lumbee
13.8%
SINGLE MALE POVERTY
0.3/ 100
METRIC RATING
260th/ 347
METRIC RANK
25.2%
SINGLE MALE POVERTY
0.0/ 100
METRIC RATING
344th/ 347
METRIC RANK
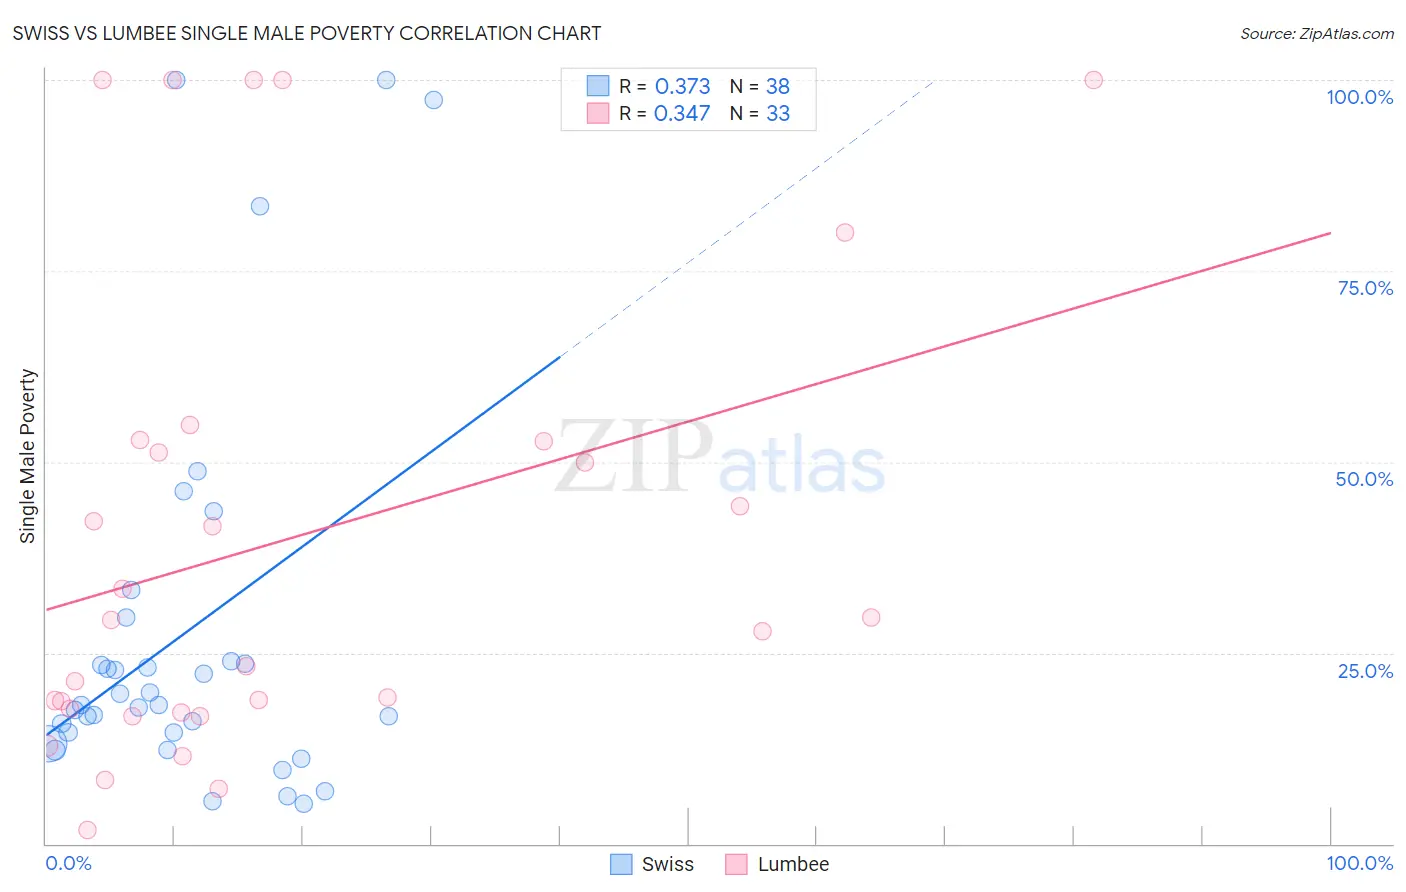
Swiss vs Lumbee Single Male Poverty Correlation Chart
The statistical analysis conducted on geographies consisting of 396,994,211 people shows a mild positive correlation between the proportion of Swiss and poverty level among single males in the United States with a correlation coefficient (R) of 0.373 and weighted average of 13.8%. Similarly, the statistical analysis conducted on geographies consisting of 87,687,707 people shows a mild positive correlation between the proportion of Lumbee and poverty level among single males in the United States with a correlation coefficient (R) of 0.347 and weighted average of 25.2%, a difference of 82.6%.
Single Male Poverty Correlation Summary
| Measurement | Swiss | Lumbee |
| Minimum | 5.3% | 1.9% |
| Maximum | 100.0% | 100.0% |
| Range | 94.7% | 98.1% |
| Mean | 27.6% | 40.0% |
| Median | 18.2% | 29.4% |
| Interquartile 25% (IQ1) | 14.5% | 17.5% |
| Interquartile 75% (IQ3) | 23.8% | 52.8% |
| Interquartile Range (IQR) | 9.3% | 35.4% |
| Standard Deviation (Sample) | 25.6% | 30.8% |
| Standard Deviation (Population) | 25.3% | 30.4% |
Similar Demographics by Single Male Poverty
Demographics Similar to Swiss by Single Male Poverty
In terms of single male poverty, the demographic groups most similar to Swiss are Hungarian (13.8%, a difference of 0.050%), Guatemalan (13.8%, a difference of 0.070%), Immigrants from Guatemala (13.8%, a difference of 0.11%), Immigrants from Central America (13.8%, a difference of 0.18%), and Fijian (13.8%, a difference of 0.22%).
| Demographics | Rating | Rank | Single Male Poverty |
| German Russians | 0.8 /100 | #253 | Tragic 13.6% |
| Sub-Saharan Africans | 0.5 /100 | #254 | Tragic 13.7% |
| Spaniards | 0.4 /100 | #255 | Tragic 13.7% |
| Immigrants | Belize | 0.4 /100 | #256 | Tragic 13.7% |
| Immigrants | Central America | 0.3 /100 | #257 | Tragic 13.8% |
| Immigrants | Guatemala | 0.3 /100 | #258 | Tragic 13.8% |
| Guatemalans | 0.3 /100 | #259 | Tragic 13.8% |
| Swiss | 0.3 /100 | #260 | Tragic 13.8% |
| Hungarians | 0.3 /100 | #261 | Tragic 13.8% |
| Fijians | 0.3 /100 | #262 | Tragic 13.8% |
| Cape Verdeans | 0.2 /100 | #263 | Tragic 13.8% |
| West Indians | 0.2 /100 | #264 | Tragic 13.8% |
| Immigrants | Congo | 0.2 /100 | #265 | Tragic 13.9% |
| Immigrants | Cabo Verde | 0.1 /100 | #266 | Tragic 13.9% |
| Germans | 0.1 /100 | #267 | Tragic 13.9% |
Demographics Similar to Lumbee by Single Male Poverty
In terms of single male poverty, the demographic groups most similar to Lumbee are Puerto Rican (25.1%, a difference of 0.31%), Navajo (25.3%, a difference of 0.73%), Houma (23.5%, a difference of 7.3%), Crow (23.3%, a difference of 8.1%), and Hopi (27.5%, a difference of 9.3%).
| Demographics | Rating | Rank | Single Male Poverty |
| Inupiat | 0.0 /100 | #333 | Tragic 20.0% |
| Pima | 0.0 /100 | #334 | Tragic 20.2% |
| Yuman | 0.0 /100 | #335 | Tragic 21.3% |
| Tohono O'odham | 0.0 /100 | #336 | Tragic 21.6% |
| Apache | 0.0 /100 | #337 | Tragic 21.6% |
| Pueblo | 0.0 /100 | #338 | Tragic 21.6% |
| Arapaho | 0.0 /100 | #339 | Tragic 21.9% |
| Sioux | 0.0 /100 | #340 | Tragic 22.2% |
| Crow | 0.0 /100 | #341 | Tragic 23.3% |
| Houma | 0.0 /100 | #342 | Tragic 23.5% |
| Puerto Ricans | 0.0 /100 | #343 | Tragic 25.1% |
| Lumbee | 0.0 /100 | #344 | Tragic 25.2% |
| Navajo | 0.0 /100 | #345 | Tragic 25.3% |
| Hopi | 0.0 /100 | #346 | Tragic 27.5% |
| Yup'ik | 0.0 /100 | #347 | Tragic 31.6% |