Swedish vs Navajo 11th Grade
COMPARE
Swedish
Navajo
11th Grade
11th Grade Comparison
Swedes
Navajo
94.9%
11TH GRADE
100.0/ 100
METRIC RATING
2nd/ 347
METRIC RANK
90.0%
11TH GRADE
0.0/ 100
METRIC RATING
297th/ 347
METRIC RANK
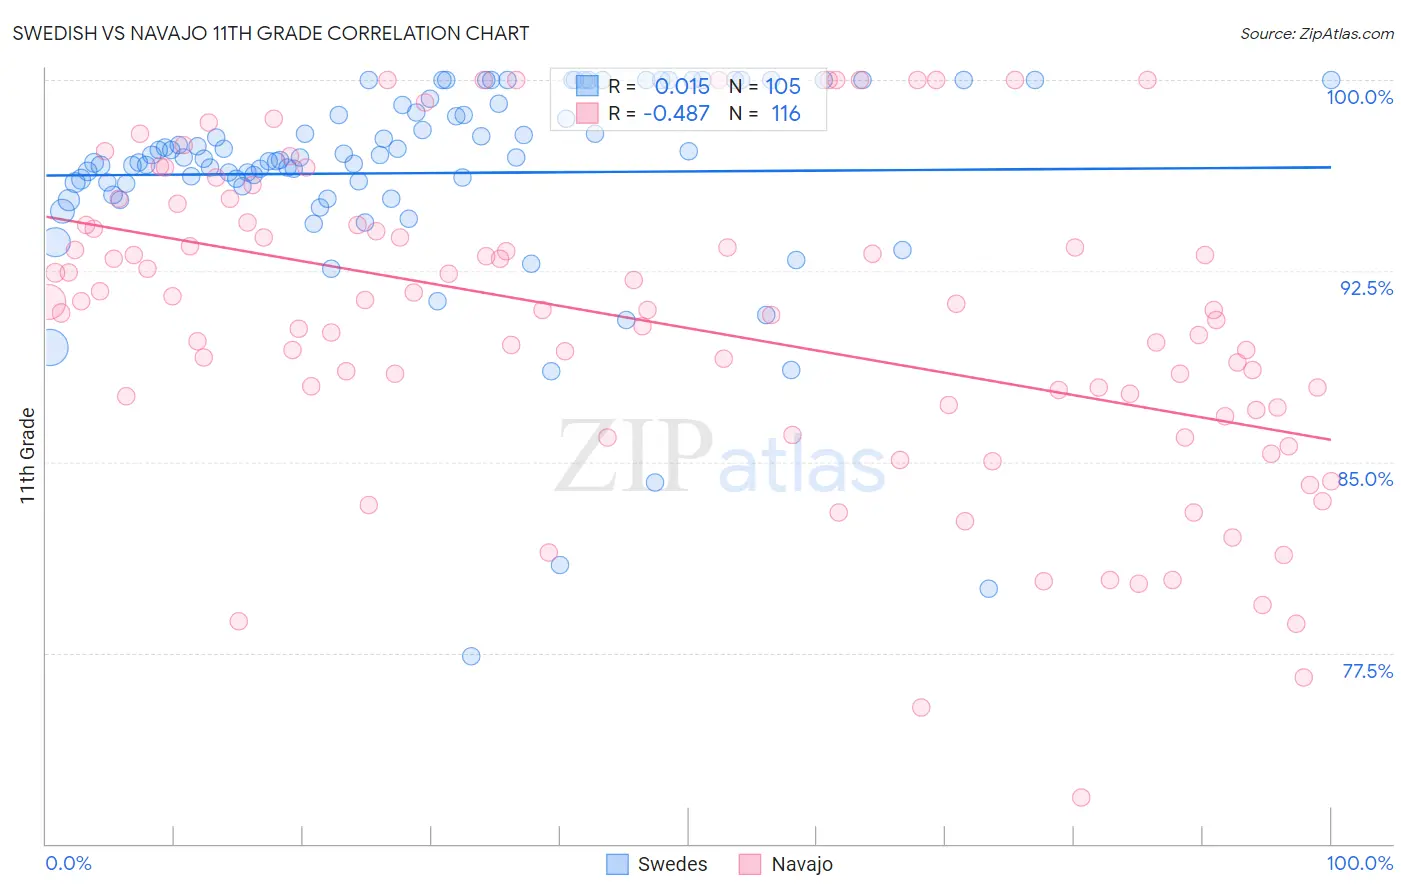
Swedish vs Navajo 11th Grade Correlation Chart
The statistical analysis conducted on geographies consisting of 539,231,897 people shows no correlation between the proportion of Swedes and percentage of population with at least 11th grade education in the United States with a correlation coefficient (R) of 0.015 and weighted average of 94.9%. Similarly, the statistical analysis conducted on geographies consisting of 224,872,858 people shows a moderate negative correlation between the proportion of Navajo and percentage of population with at least 11th grade education in the United States with a correlation coefficient (R) of -0.487 and weighted average of 90.0%, a difference of 5.5%.
11th Grade Correlation Summary
| Measurement | Swedish | Navajo |
| Minimum | 77.4% | 71.8% |
| Maximum | 100.0% | 100.0% |
| Range | 22.6% | 28.2% |
| Mean | 96.3% | 90.4% |
| Median | 96.9% | 91.0% |
| Interquartile 25% (IQ1) | 95.9% | 87.1% |
| Interquartile 75% (IQ3) | 99.0% | 94.2% |
| Interquartile Range (IQR) | 3.1% | 7.2% |
| Standard Deviation (Sample) | 4.1% | 6.1% |
| Standard Deviation (Population) | 4.1% | 6.1% |
Similar Demographics by 11th Grade
Demographics Similar to Swedes by 11th Grade
In terms of 11th grade, the demographic groups most similar to Swedes are Slovene (94.9%, a difference of 0.010%), Slovak (94.9%, a difference of 0.040%), Carpatho Rusyn (94.8%, a difference of 0.10%), Lithuanian (94.8%, a difference of 0.14%), and Polish (94.8%, a difference of 0.20%).
| Demographics | Rating | Rank | 11th Grade |
| Norwegians | 100.0 /100 | #1 | Exceptional 95.2% |
| Swedes | 100.0 /100 | #2 | Exceptional 94.9% |
| Slovenes | 100.0 /100 | #3 | Exceptional 94.9% |
| Slovaks | 100.0 /100 | #4 | Exceptional 94.9% |
| Carpatho Rusyns | 100.0 /100 | #5 | Exceptional 94.8% |
| Lithuanians | 100.0 /100 | #6 | Exceptional 94.8% |
| Poles | 100.0 /100 | #7 | Exceptional 94.8% |
| Croatians | 100.0 /100 | #8 | Exceptional 94.7% |
| Danes | 100.0 /100 | #9 | Exceptional 94.7% |
| Finns | 100.0 /100 | #10 | Exceptional 94.7% |
| Germans | 100.0 /100 | #11 | Exceptional 94.7% |
| Latvians | 100.0 /100 | #12 | Exceptional 94.7% |
| Chinese | 100.0 /100 | #13 | Exceptional 94.6% |
| Eastern Europeans | 100.0 /100 | #14 | Exceptional 94.6% |
| Bulgarians | 100.0 /100 | #15 | Exceptional 94.5% |
Demographics Similar to Navajo by 11th Grade
In terms of 11th grade, the demographic groups most similar to Navajo are Fijian (90.0%, a difference of 0.040%), Immigrants from Vietnam (90.0%, a difference of 0.060%), Immigrants from Fiji (89.9%, a difference of 0.070%), Japanese (89.9%, a difference of 0.10%), and Immigrants from Haiti (89.9%, a difference of 0.11%).
| Demographics | Rating | Rank | 11th Grade |
| Indonesians | 0.0 /100 | #290 | Tragic 90.3% |
| Haitians | 0.0 /100 | #291 | Tragic 90.3% |
| Cubans | 0.0 /100 | #292 | Tragic 90.2% |
| Natives/Alaskans | 0.0 /100 | #293 | Tragic 90.2% |
| Immigrants | Grenada | 0.0 /100 | #294 | Tragic 90.1% |
| Immigrants | Vietnam | 0.0 /100 | #295 | Tragic 90.0% |
| Fijians | 0.0 /100 | #296 | Tragic 90.0% |
| Navajo | 0.0 /100 | #297 | Tragic 90.0% |
| Immigrants | Fiji | 0.0 /100 | #298 | Tragic 89.9% |
| Japanese | 0.0 /100 | #299 | Tragic 89.9% |
| Immigrants | Haiti | 0.0 /100 | #300 | Tragic 89.9% |
| Guyanese | 0.0 /100 | #301 | Tragic 89.9% |
| Immigrants | Guyana | 0.0 /100 | #302 | Tragic 89.7% |
| Immigrants | Immigrants | 0.0 /100 | #303 | Tragic 89.7% |
| Yuman | 0.0 /100 | #304 | Tragic 89.7% |