Swedish vs Korean Child Poverty Among Girls Under 16
COMPARE
Swedish
Korean
Child Poverty Among Girls Under 16
Child Poverty Among Girls Under 16 Comparison
Swedes
Koreans
13.7%
CHILD POVERTY AMONG GIRLS UNDER 16
99.7/ 100
METRIC RATING
33rd/ 347
METRIC RANK
14.1%
CHILD POVERTY AMONG GIRLS UNDER 16
99.4/ 100
METRIC RATING
43rd/ 347
METRIC RANK
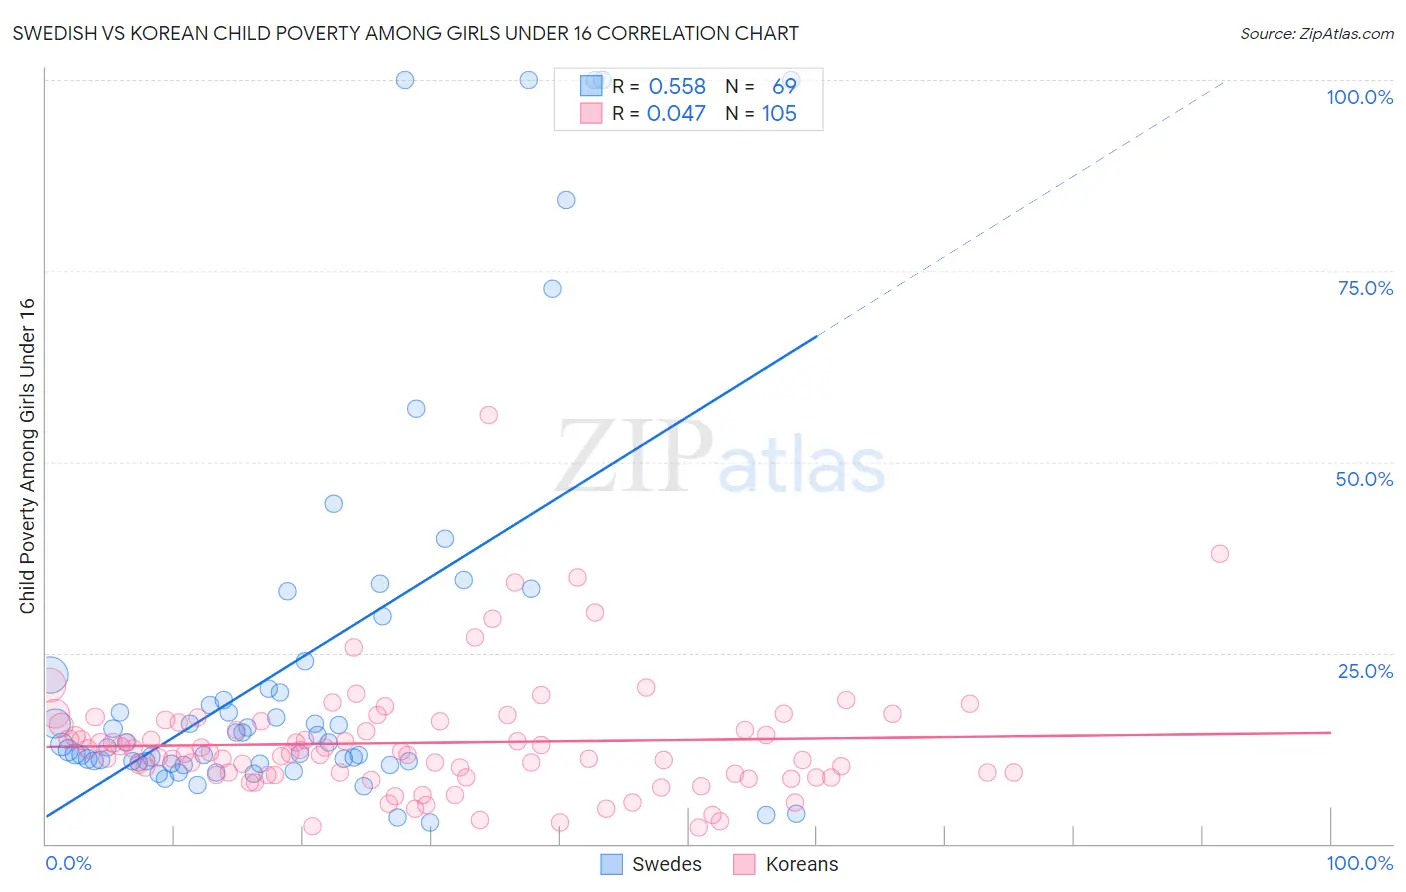
Swedish vs Korean Child Poverty Among Girls Under 16 Correlation Chart
The statistical analysis conducted on geographies consisting of 519,531,416 people shows a substantial positive correlation between the proportion of Swedes and poverty level among girls under the age of 16 in the United States with a correlation coefficient (R) of 0.558 and weighted average of 13.7%. Similarly, the statistical analysis conducted on geographies consisting of 497,455,609 people shows no correlation between the proportion of Koreans and poverty level among girls under the age of 16 in the United States with a correlation coefficient (R) of 0.047 and weighted average of 14.1%, a difference of 2.6%.
Child Poverty Among Girls Under 16 Correlation Summary
| Measurement | Swedish | Korean |
| Minimum | 2.7% | 2.1% |
| Maximum | 100.0% | 56.1% |
| Range | 97.3% | 54.0% |
| Mean | 23.7% | 13.2% |
| Median | 13.2% | 11.8% |
| Interquartile 25% (IQ1) | 10.7% | 9.0% |
| Interquartile 75% (IQ3) | 21.2% | 16.0% |
| Interquartile Range (IQR) | 10.4% | 7.0% |
| Standard Deviation (Sample) | 25.8% | 7.8% |
| Standard Deviation (Population) | 25.6% | 7.8% |
Demographics Similar to Swedes and Koreans by Child Poverty Among Girls Under 16
In terms of child poverty among girls under 16, the demographic groups most similar to Swedes are Danish (13.7%, a difference of 0.030%), Maltese (13.7%, a difference of 0.050%), Turkish (13.7%, a difference of 0.070%), Asian (13.7%, a difference of 0.19%), and Bolivian (13.6%, a difference of 0.87%). Similarly, the demographic groups most similar to Koreans are Immigrants from Scotland (14.0%, a difference of 0.14%), Immigrants from Asia (14.1%, a difference of 0.14%), Immigrants from Sri Lanka (14.0%, a difference of 0.31%), Immigrants from Bolivia (14.0%, a difference of 0.31%), and Immigrants from Australia (14.0%, a difference of 0.40%).
| Demographics | Rating | Rank | Child Poverty Among Girls Under 16 |
| Tongans | 99.8 /100 | #28 | Exceptional 13.6% |
| Bolivians | 99.8 /100 | #29 | Exceptional 13.6% |
| Asians | 99.7 /100 | #30 | Exceptional 13.7% |
| Turks | 99.7 /100 | #31 | Exceptional 13.7% |
| Danes | 99.7 /100 | #32 | Exceptional 13.7% |
| Swedes | 99.7 /100 | #33 | Exceptional 13.7% |
| Maltese | 99.7 /100 | #34 | Exceptional 13.7% |
| Immigrants | Northern Europe | 99.6 /100 | #35 | Exceptional 13.8% |
| Russians | 99.6 /100 | #36 | Exceptional 13.9% |
| Lithuanians | 99.6 /100 | #37 | Exceptional 13.9% |
| Immigrants | Moldova | 99.6 /100 | #38 | Exceptional 13.9% |
| Immigrants | Australia | 99.5 /100 | #39 | Exceptional 14.0% |
| Immigrants | Sri Lanka | 99.5 /100 | #40 | Exceptional 14.0% |
| Immigrants | Bolivia | 99.5 /100 | #41 | Exceptional 14.0% |
| Immigrants | Scotland | 99.4 /100 | #42 | Exceptional 14.0% |
| Koreans | 99.4 /100 | #43 | Exceptional 14.1% |
| Immigrants | Asia | 99.4 /100 | #44 | Exceptional 14.1% |
| Immigrants | Greece | 99.3 /100 | #45 | Exceptional 14.1% |
| Croatians | 99.3 /100 | #46 | Exceptional 14.1% |
| Immigrants | Czechoslovakia | 99.3 /100 | #47 | Exceptional 14.2% |
| Czechs | 99.3 /100 | #48 | Exceptional 14.2% |