Swedish vs Navajo Unemployment Among Women with Children Under 6 years
COMPARE
Swedish
Navajo
Unemployment Among Women with Children Under 6 years
Unemployment Among Women with Children Under 6 years Comparison
Swedes
Navajo
7.4%
UNEMPLOYMENT AMONG WOMEN WITH CHILDREN UNDER 6 YEARS
88.4/ 100
METRIC RATING
130th/ 347
METRIC RANK
13.5%
UNEMPLOYMENT AMONG WOMEN WITH CHILDREN UNDER 6 YEARS
0.0/ 100
METRIC RATING
339th/ 347
METRIC RANK
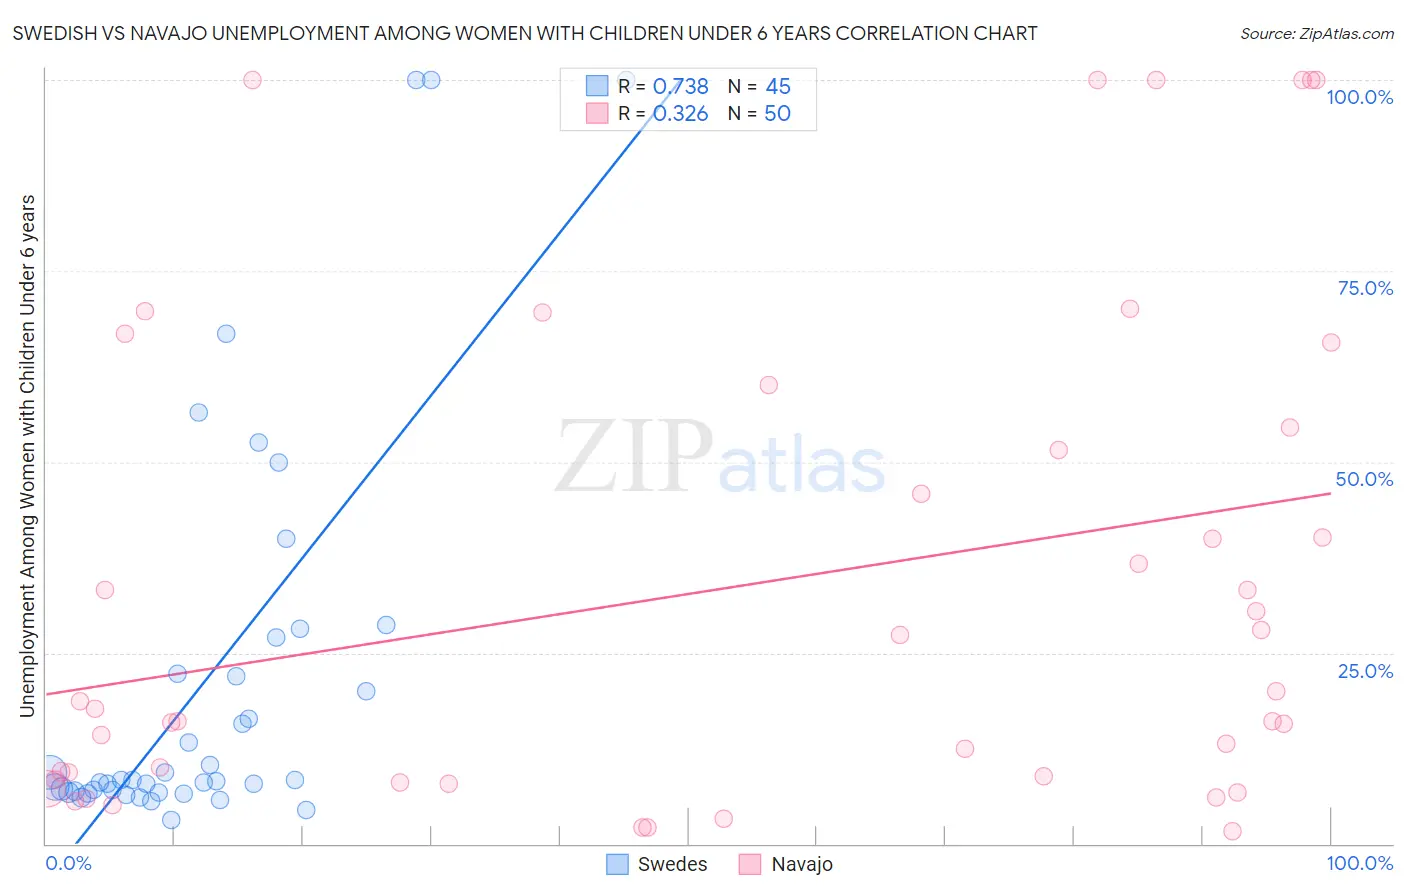
Swedish vs Navajo Unemployment Among Women with Children Under 6 years Correlation Chart
The statistical analysis conducted on geographies consisting of 362,245,772 people shows a strong positive correlation between the proportion of Swedes and unemployment rate among women with children under the age of 6 in the United States with a correlation coefficient (R) of 0.738 and weighted average of 7.4%. Similarly, the statistical analysis conducted on geographies consisting of 189,295,070 people shows a mild positive correlation between the proportion of Navajo and unemployment rate among women with children under the age of 6 in the United States with a correlation coefficient (R) of 0.326 and weighted average of 13.5%, a difference of 82.6%.
Unemployment Among Women with Children Under 6 years Correlation Summary
| Measurement | Swedish | Navajo |
| Minimum | 3.1% | 1.7% |
| Maximum | 100.0% | 100.0% |
| Range | 96.9% | 98.3% |
| Mean | 21.3% | 33.8% |
| Median | 8.4% | 18.1% |
| Interquartile 25% (IQ1) | 6.8% | 8.4% |
| Interquartile 75% (IQ3) | 24.6% | 54.5% |
| Interquartile Range (IQR) | 17.8% | 46.1% |
| Standard Deviation (Sample) | 26.1% | 32.0% |
| Standard Deviation (Population) | 25.8% | 31.7% |
Similar Demographics by Unemployment Among Women with Children Under 6 years
Demographics Similar to Swedes by Unemployment Among Women with Children Under 6 years
In terms of unemployment among women with children under 6 years, the demographic groups most similar to Swedes are Ukrainian (7.4%, a difference of 0.040%), Slovene (7.4%, a difference of 0.14%), Immigrants from Armenia (7.4%, a difference of 0.17%), Immigrants from Uganda (7.4%, a difference of 0.29%), and Immigrants from Bolivia (7.4%, a difference of 0.40%).
| Demographics | Rating | Rank | Unemployment Among Women with Children Under 6 years |
| Immigrants | Zaire | 93.3 /100 | #123 | Exceptional 7.3% |
| Immigrants | South Africa | 92.5 /100 | #124 | Exceptional 7.3% |
| Pakistanis | 92.2 /100 | #125 | Exceptional 7.3% |
| Immigrants | Burma/Myanmar | 91.9 /100 | #126 | Exceptional 7.3% |
| Jordanians | 91.5 /100 | #127 | Exceptional 7.3% |
| Zimbabweans | 91.5 /100 | #128 | Exceptional 7.3% |
| Slovenes | 89.2 /100 | #129 | Excellent 7.4% |
| Swedes | 88.4 /100 | #130 | Excellent 7.4% |
| Ukrainians | 88.2 /100 | #131 | Excellent 7.4% |
| Immigrants | Armenia | 87.4 /100 | #132 | Excellent 7.4% |
| Immigrants | Uganda | 86.5 /100 | #133 | Excellent 7.4% |
| Immigrants | Bolivia | 85.7 /100 | #134 | Excellent 7.4% |
| Immigrants | Northern Africa | 85.3 /100 | #135 | Excellent 7.4% |
| Immigrants | Morocco | 84.9 /100 | #136 | Excellent 7.4% |
| Immigrants | Cambodia | 84.6 /100 | #137 | Excellent 7.4% |
Demographics Similar to Navajo by Unemployment Among Women with Children Under 6 years
In terms of unemployment among women with children under 6 years, the demographic groups most similar to Navajo are Immigrants from Yemen (13.5%, a difference of 0.0%), Pima (13.4%, a difference of 0.40%), Chippewa (13.3%, a difference of 1.2%), Lumbee (13.8%, a difference of 2.2%), and Shoshone (13.2%, a difference of 2.3%).
| Demographics | Rating | Rank | Unemployment Among Women with Children Under 6 years |
| Sioux | 0.0 /100 | #332 | Tragic 11.5% |
| Natives/Alaskans | 0.0 /100 | #333 | Tragic 11.5% |
| Apache | 0.0 /100 | #334 | Tragic 12.3% |
| Puerto Ricans | 0.0 /100 | #335 | Tragic 12.5% |
| Shoshone | 0.0 /100 | #336 | Tragic 13.2% |
| Chippewa | 0.0 /100 | #337 | Tragic 13.3% |
| Pima | 0.0 /100 | #338 | Tragic 13.4% |
| Navajo | 0.0 /100 | #339 | Tragic 13.5% |
| Immigrants | Yemen | 0.0 /100 | #340 | Tragic 13.5% |
| Lumbee | 0.0 /100 | #341 | Tragic 13.8% |
| Yuman | 0.0 /100 | #342 | Tragic 14.6% |
| Crow | 0.0 /100 | #343 | Tragic 14.6% |
| Hopi | 0.0 /100 | #344 | Tragic 16.8% |
| Inupiat | 0.0 /100 | #345 | Tragic 17.7% |
| Arapaho | 0.0 /100 | #346 | Tragic 19.0% |