Immigrants from Haiti vs Immigrants from Scotland Single Female Poverty
COMPARE
Immigrants from Haiti
Immigrants from Scotland
Single Female Poverty
Single Female Poverty Comparison
Immigrants from Haiti
Immigrants from Scotland
21.5%
SINGLE FEMALE POVERTY
18.8/ 100
METRIC RATING
203rd/ 347
METRIC RANK
19.4%
SINGLE FEMALE POVERTY
99.2/ 100
METRIC RATING
81st/ 347
METRIC RANK
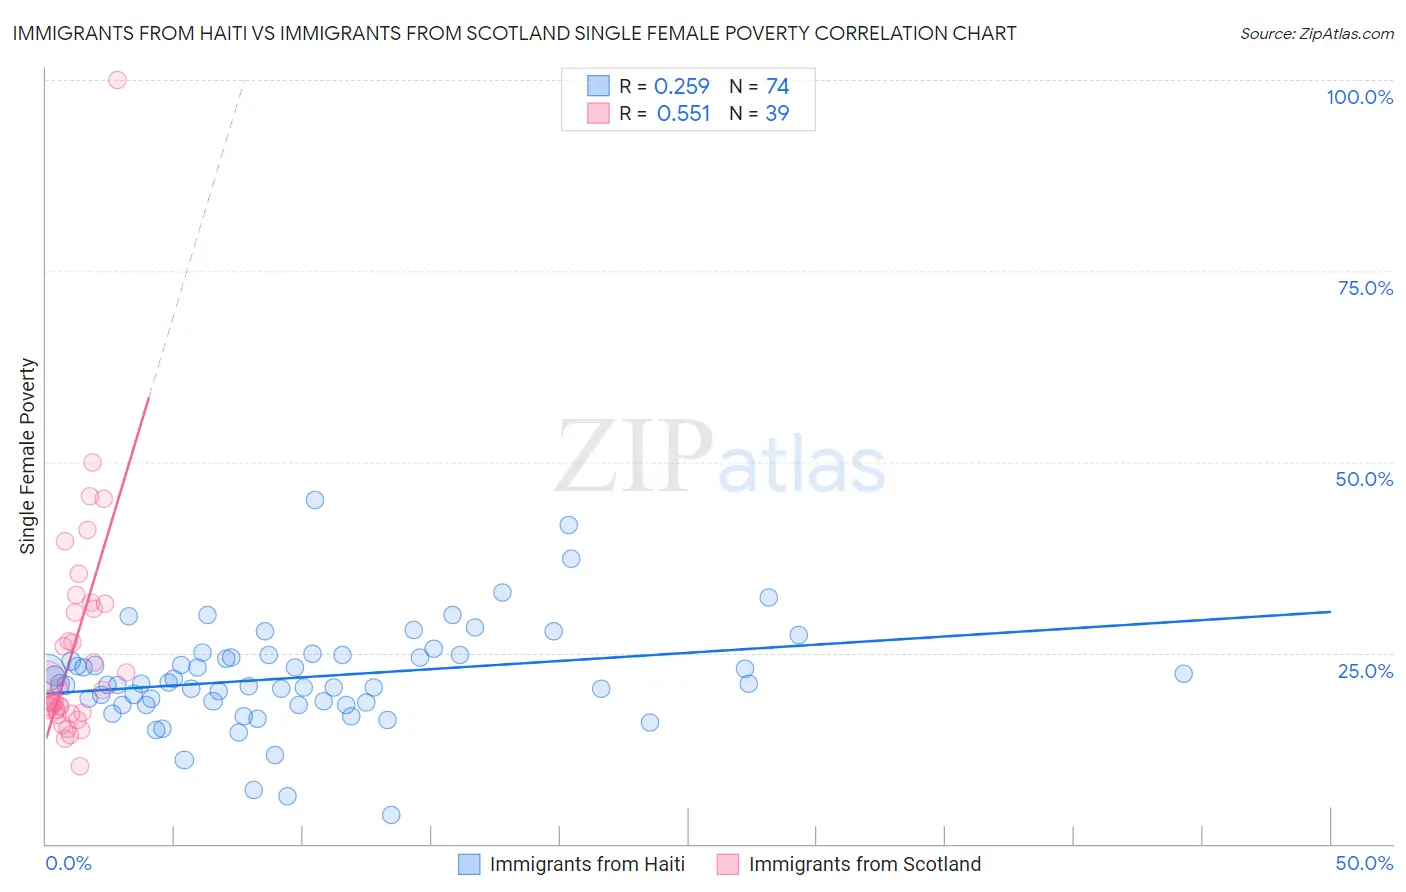
Immigrants from Haiti vs Immigrants from Scotland Single Female Poverty Correlation Chart
The statistical analysis conducted on geographies consisting of 223,147,681 people shows a weak positive correlation between the proportion of Immigrants from Haiti and poverty level among single females in the United States with a correlation coefficient (R) of 0.259 and weighted average of 21.5%. Similarly, the statistical analysis conducted on geographies consisting of 194,087,969 people shows a substantial positive correlation between the proportion of Immigrants from Scotland and poverty level among single females in the United States with a correlation coefficient (R) of 0.551 and weighted average of 19.4%, a difference of 10.7%.
Single Female Poverty Correlation Summary
| Measurement | Immigrants from Haiti | Immigrants from Scotland |
| Minimum | 3.7% | 10.1% |
| Maximum | 45.0% | 100.0% |
| Range | 41.2% | 89.9% |
| Mean | 21.8% | 26.0% |
| Median | 20.9% | 20.2% |
| Interquartile 25% (IQ1) | 18.5% | 17.1% |
| Interquartile 75% (IQ3) | 24.7% | 31.4% |
| Interquartile Range (IQR) | 6.2% | 14.3% |
| Standard Deviation (Sample) | 6.8% | 15.7% |
| Standard Deviation (Population) | 6.7% | 15.5% |
Similar Demographics by Single Female Poverty
Demographics Similar to Immigrants from Haiti by Single Female Poverty
In terms of single female poverty, the demographic groups most similar to Immigrants from Haiti are Immigrants from Kenya (21.4%, a difference of 0.18%), Nigerian (21.4%, a difference of 0.20%), Immigrants from Africa (21.5%, a difference of 0.21%), Irish (21.4%, a difference of 0.25%), and Finnish (21.5%, a difference of 0.27%).
| Demographics | Rating | Rank | Single Female Poverty |
| Immigrants | Saudi Arabia | 27.1 /100 | #196 | Fair 21.3% |
| Japanese | 26.4 /100 | #197 | Fair 21.3% |
| Swiss | 24.2 /100 | #198 | Fair 21.4% |
| Immigrants | Immigrants | 22.0 /100 | #199 | Fair 21.4% |
| Irish | 21.4 /100 | #200 | Fair 21.4% |
| Nigerians | 20.9 /100 | #201 | Fair 21.4% |
| Immigrants | Kenya | 20.7 /100 | #202 | Fair 21.4% |
| Immigrants | Haiti | 18.8 /100 | #203 | Poor 21.5% |
| Immigrants | Africa | 16.7 /100 | #204 | Poor 21.5% |
| Finns | 16.2 /100 | #205 | Poor 21.5% |
| Belgians | 16.1 /100 | #206 | Poor 21.5% |
| Ghanaians | 15.7 /100 | #207 | Poor 21.6% |
| Haitians | 15.4 /100 | #208 | Poor 21.6% |
| Immigrants | Eastern Africa | 15.1 /100 | #209 | Poor 21.6% |
| Immigrants | Panama | 14.4 /100 | #210 | Poor 21.6% |
Demographics Similar to Immigrants from Scotland by Single Female Poverty
In terms of single female poverty, the demographic groups most similar to Immigrants from Scotland are Immigrants from Malaysia (19.4%, a difference of 0.010%), Immigrants from Australia (19.4%, a difference of 0.020%), Taiwanese (19.4%, a difference of 0.020%), Immigrants from Sierra Leone (19.4%, a difference of 0.060%), and Albanian (19.4%, a difference of 0.080%).
| Demographics | Rating | Rank | Single Female Poverty |
| Immigrants | Belarus | 99.4 /100 | #74 | Exceptional 19.3% |
| Immigrants | Turkey | 99.4 /100 | #75 | Exceptional 19.4% |
| Peruvians | 99.4 /100 | #76 | Exceptional 19.4% |
| Immigrants | Russia | 99.3 /100 | #77 | Exceptional 19.4% |
| Albanians | 99.3 /100 | #78 | Exceptional 19.4% |
| Immigrants | Sierra Leone | 99.3 /100 | #79 | Exceptional 19.4% |
| Immigrants | Australia | 99.3 /100 | #80 | Exceptional 19.4% |
| Immigrants | Scotland | 99.2 /100 | #81 | Exceptional 19.4% |
| Immigrants | Malaysia | 99.2 /100 | #82 | Exceptional 19.4% |
| Taiwanese | 99.2 /100 | #83 | Exceptional 19.4% |
| Immigrants | Sweden | 99.2 /100 | #84 | Exceptional 19.4% |
| Immigrants | Albania | 99.2 /100 | #85 | Exceptional 19.4% |
| Greeks | 99.2 /100 | #86 | Exceptional 19.4% |
| Zimbabweans | 99.0 /100 | #87 | Exceptional 19.5% |
| Afghans | 99.0 /100 | #88 | Exceptional 19.5% |