Senegalese vs Immigrants from Scotland Single Female Poverty
COMPARE
Senegalese
Immigrants from Scotland
Single Female Poverty
Single Female Poverty Comparison
Senegalese
Immigrants from Scotland
23.0%
SINGLE FEMALE POVERTY
0.2/ 100
METRIC RATING
267th/ 347
METRIC RANK
19.4%
SINGLE FEMALE POVERTY
99.2/ 100
METRIC RATING
81st/ 347
METRIC RANK
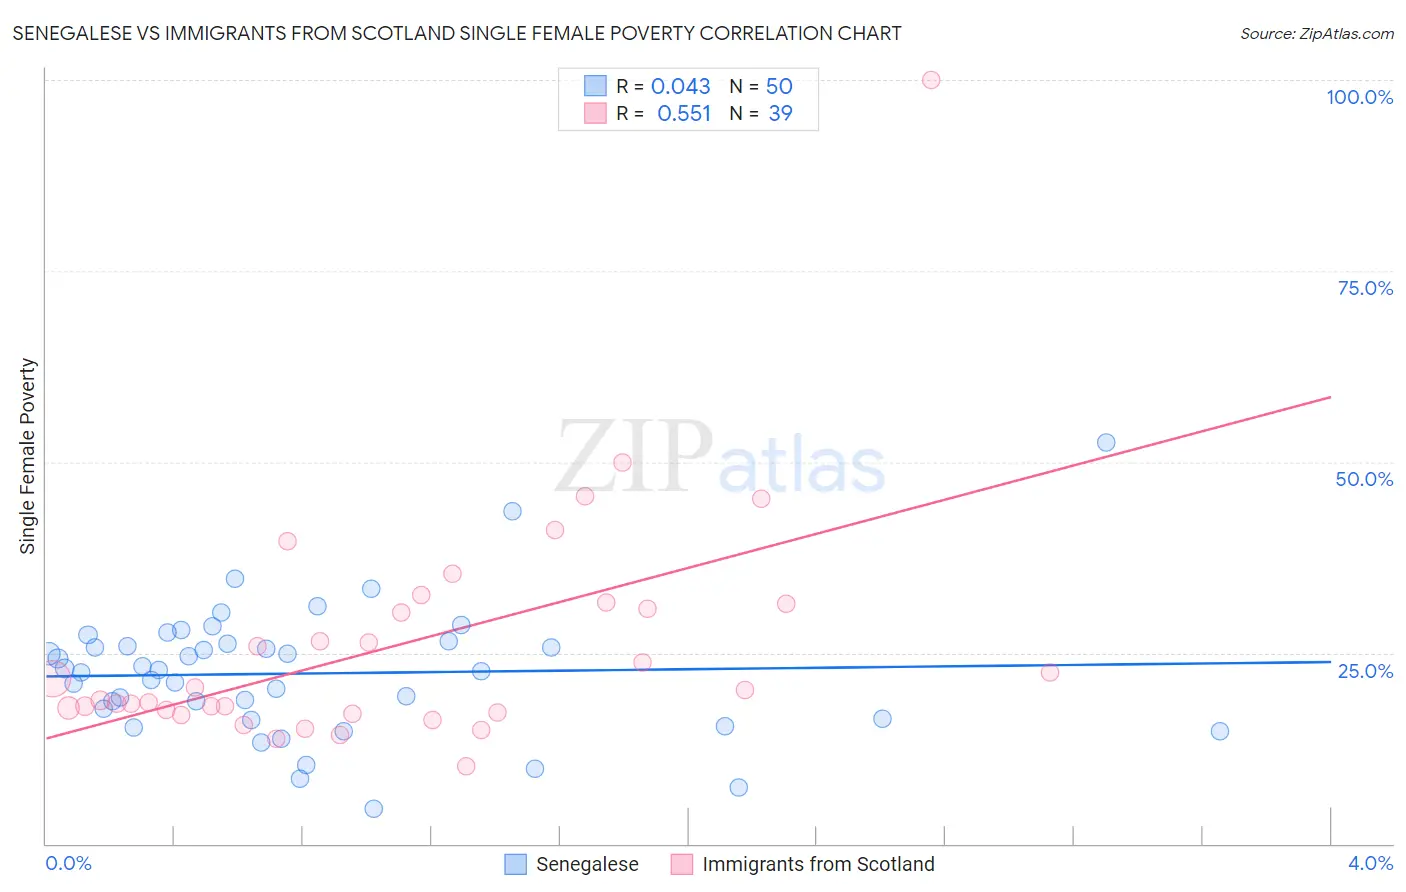
Senegalese vs Immigrants from Scotland Single Female Poverty Correlation Chart
The statistical analysis conducted on geographies consisting of 77,927,948 people shows no correlation between the proportion of Senegalese and poverty level among single females in the United States with a correlation coefficient (R) of 0.043 and weighted average of 23.0%. Similarly, the statistical analysis conducted on geographies consisting of 194,087,969 people shows a substantial positive correlation between the proportion of Immigrants from Scotland and poverty level among single females in the United States with a correlation coefficient (R) of 0.551 and weighted average of 19.4%, a difference of 18.7%.
Single Female Poverty Correlation Summary
| Measurement | Senegalese | Immigrants from Scotland |
| Minimum | 4.5% | 10.1% |
| Maximum | 52.6% | 100.0% |
| Range | 48.1% | 89.9% |
| Mean | 22.3% | 26.0% |
| Median | 22.7% | 20.2% |
| Interquartile 25% (IQ1) | 16.3% | 17.1% |
| Interquartile 75% (IQ3) | 26.2% | 31.4% |
| Interquartile Range (IQR) | 9.9% | 14.3% |
| Standard Deviation (Sample) | 8.6% | 15.7% |
| Standard Deviation (Population) | 8.5% | 15.5% |
Similar Demographics by Single Female Poverty
Demographics Similar to Senegalese by Single Female Poverty
In terms of single female poverty, the demographic groups most similar to Senegalese are Immigrants from Micronesia (23.0%, a difference of 0.060%), Fijian (23.1%, a difference of 0.070%), Hmong (23.1%, a difference of 0.10%), Central American (23.0%, a difference of 0.27%), and Inupiat (23.1%, a difference of 0.35%).
| Demographics | Rating | Rank | Single Female Poverty |
| Celtics | 0.5 /100 | #260 | Tragic 22.7% |
| Immigrants | Cabo Verde | 0.4 /100 | #261 | Tragic 22.8% |
| British West Indians | 0.4 /100 | #262 | Tragic 22.8% |
| Scotch-Irish | 0.3 /100 | #263 | Tragic 22.9% |
| Immigrants | Laos | 0.3 /100 | #264 | Tragic 22.9% |
| Central Americans | 0.2 /100 | #265 | Tragic 23.0% |
| Immigrants | Micronesia | 0.2 /100 | #266 | Tragic 23.0% |
| Senegalese | 0.2 /100 | #267 | Tragic 23.0% |
| Fijians | 0.2 /100 | #268 | Tragic 23.1% |
| Hmong | 0.2 /100 | #269 | Tragic 23.1% |
| Inupiat | 0.2 /100 | #270 | Tragic 23.1% |
| Sub-Saharan Africans | 0.1 /100 | #271 | Tragic 23.2% |
| Immigrants | Senegal | 0.1 /100 | #272 | Tragic 23.2% |
| Alaska Natives | 0.1 /100 | #273 | Tragic 23.3% |
| Marshallese | 0.1 /100 | #274 | Tragic 23.3% |
Demographics Similar to Immigrants from Scotland by Single Female Poverty
In terms of single female poverty, the demographic groups most similar to Immigrants from Scotland are Immigrants from Malaysia (19.4%, a difference of 0.010%), Immigrants from Australia (19.4%, a difference of 0.020%), Taiwanese (19.4%, a difference of 0.020%), Immigrants from Sierra Leone (19.4%, a difference of 0.060%), and Albanian (19.4%, a difference of 0.080%).
| Demographics | Rating | Rank | Single Female Poverty |
| Immigrants | Belarus | 99.4 /100 | #74 | Exceptional 19.3% |
| Immigrants | Turkey | 99.4 /100 | #75 | Exceptional 19.4% |
| Peruvians | 99.4 /100 | #76 | Exceptional 19.4% |
| Immigrants | Russia | 99.3 /100 | #77 | Exceptional 19.4% |
| Albanians | 99.3 /100 | #78 | Exceptional 19.4% |
| Immigrants | Sierra Leone | 99.3 /100 | #79 | Exceptional 19.4% |
| Immigrants | Australia | 99.3 /100 | #80 | Exceptional 19.4% |
| Immigrants | Scotland | 99.2 /100 | #81 | Exceptional 19.4% |
| Immigrants | Malaysia | 99.2 /100 | #82 | Exceptional 19.4% |
| Taiwanese | 99.2 /100 | #83 | Exceptional 19.4% |
| Immigrants | Sweden | 99.2 /100 | #84 | Exceptional 19.4% |
| Immigrants | Albania | 99.2 /100 | #85 | Exceptional 19.4% |
| Greeks | 99.2 /100 | #86 | Exceptional 19.4% |
| Zimbabweans | 99.0 /100 | #87 | Exceptional 19.5% |
| Afghans | 99.0 /100 | #88 | Exceptional 19.5% |