Subsaharan African vs Assyrian/Chaldean/Syriac Child Poverty Among Boys Under 16
COMPARE
Subsaharan African
Assyrian/Chaldean/Syriac
Child Poverty Among Boys Under 16
Child Poverty Among Boys Under 16 Comparison
Sub-Saharan Africans
Assyrians/Chaldeans/Syriacs
20.0%
CHILD POVERTY AMONG BOYS UNDER 16
0.0/ 100
METRIC RATING
276th/ 347
METRIC RANK
13.6%
CHILD POVERTY AMONG BOYS UNDER 16
99.8/ 100
METRIC RATING
34th/ 347
METRIC RANK
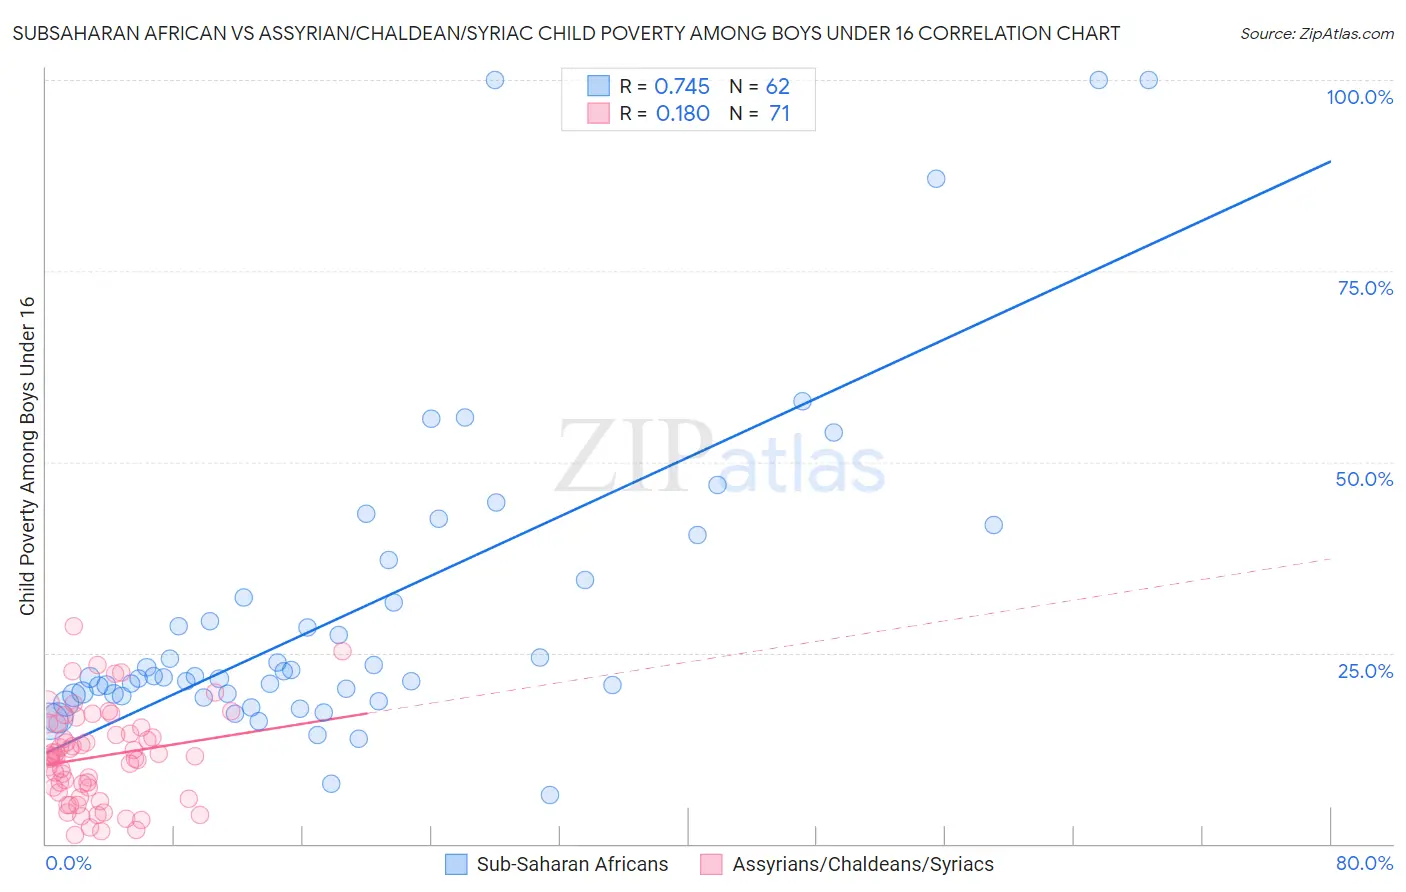
Subsaharan African vs Assyrian/Chaldean/Syriac Child Poverty Among Boys Under 16 Correlation Chart
The statistical analysis conducted on geographies consisting of 497,613,414 people shows a strong positive correlation between the proportion of Sub-Saharan Africans and poverty level among boys under the age of 16 in the United States with a correlation coefficient (R) of 0.745 and weighted average of 20.0%. Similarly, the statistical analysis conducted on geographies consisting of 109,529,261 people shows a poor positive correlation between the proportion of Assyrians/Chaldeans/Syriacs and poverty level among boys under the age of 16 in the United States with a correlation coefficient (R) of 0.180 and weighted average of 13.6%, a difference of 46.6%.
Child Poverty Among Boys Under 16 Correlation Summary
| Measurement | Subsaharan African | Assyrian/Chaldean/Syriac |
| Minimum | 6.5% | 1.2% |
| Maximum | 100.0% | 28.5% |
| Range | 93.5% | 27.3% |
| Mean | 30.6% | 11.4% |
| Median | 21.9% | 11.5% |
| Interquartile 25% (IQ1) | 19.4% | 6.7% |
| Interquartile 75% (IQ3) | 34.6% | 15.2% |
| Interquartile Range (IQR) | 15.2% | 8.4% |
| Standard Deviation (Sample) | 21.0% | 6.1% |
| Standard Deviation (Population) | 20.8% | 6.0% |
Similar Demographics by Child Poverty Among Boys Under 16
Demographics Similar to Sub-Saharan Africans by Child Poverty Among Boys Under 16
In terms of child poverty among boys under 16, the demographic groups most similar to Sub-Saharan Africans are Immigrants from Barbados (20.0%, a difference of 0.10%), Immigrants from West Indies (20.0%, a difference of 0.12%), Jamaican (20.0%, a difference of 0.17%), Bangladeshi (20.0%, a difference of 0.25%), and Immigrants from Bangladesh (19.9%, a difference of 0.29%).
| Demographics | Rating | Rank | Child Poverty Among Boys Under 16 |
| Immigrants | Cabo Verde | 0.1 /100 | #269 | Tragic 19.7% |
| Cherokee | 0.1 /100 | #270 | Tragic 19.7% |
| Chickasaw | 0.1 /100 | #271 | Tragic 19.8% |
| Immigrants | Ecuador | 0.1 /100 | #272 | Tragic 19.8% |
| Belizeans | 0.1 /100 | #273 | Tragic 19.9% |
| Immigrants | Bangladesh | 0.0 /100 | #274 | Tragic 19.9% |
| Jamaicans | 0.0 /100 | #275 | Tragic 20.0% |
| Sub-Saharan Africans | 0.0 /100 | #276 | Tragic 20.0% |
| Immigrants | Barbados | 0.0 /100 | #277 | Tragic 20.0% |
| Immigrants | West Indies | 0.0 /100 | #278 | Tragic 20.0% |
| Bangladeshis | 0.0 /100 | #279 | Tragic 20.0% |
| Central Americans | 0.0 /100 | #280 | Tragic 20.1% |
| Immigrants | Zaire | 0.0 /100 | #281 | Tragic 20.1% |
| Comanche | 0.0 /100 | #282 | Tragic 20.1% |
| Immigrants | Jamaica | 0.0 /100 | #283 | Tragic 20.1% |
Demographics Similar to Assyrians/Chaldeans/Syriacs by Child Poverty Among Boys Under 16
In terms of child poverty among boys under 16, the demographic groups most similar to Assyrians/Chaldeans/Syriacs are Danish (13.6%, a difference of 0.11%), Immigrants from China (13.6%, a difference of 0.29%), Turkish (13.6%, a difference of 0.38%), Swedish (13.6%, a difference of 0.46%), and Cypriot (13.6%, a difference of 0.55%).
| Demographics | Rating | Rank | Child Poverty Among Boys Under 16 |
| Asians | 99.8 /100 | #27 | Exceptional 13.5% |
| Eastern Europeans | 99.8 /100 | #28 | Exceptional 13.5% |
| Cypriots | 99.8 /100 | #29 | Exceptional 13.6% |
| Swedes | 99.8 /100 | #30 | Exceptional 13.6% |
| Turks | 99.8 /100 | #31 | Exceptional 13.6% |
| Immigrants | China | 99.8 /100 | #32 | Exceptional 13.6% |
| Danes | 99.8 /100 | #33 | Exceptional 13.6% |
| Assyrians/Chaldeans/Syriacs | 99.8 /100 | #34 | Exceptional 13.6% |
| Russians | 99.7 /100 | #35 | Exceptional 13.8% |
| Luxembourgers | 99.7 /100 | #36 | Exceptional 13.8% |
| Immigrants | Sri Lanka | 99.6 /100 | #37 | Exceptional 13.9% |
| Immigrants | Northern Europe | 99.6 /100 | #38 | Exceptional 13.9% |
| Immigrants | Australia | 99.6 /100 | #39 | Exceptional 13.9% |
| Immigrants | Asia | 99.6 /100 | #40 | Exceptional 13.9% |
| Lithuanians | 99.6 /100 | #41 | Exceptional 14.0% |