Subsaharan African vs Guamanian/Chamorro Child Poverty Among Boys Under 16
COMPARE
Subsaharan African
Guamanian/Chamorro
Child Poverty Among Boys Under 16
Child Poverty Among Boys Under 16 Comparison
Sub-Saharan Africans
Guamanians/Chamorros
20.0%
CHILD POVERTY AMONG BOYS UNDER 16
0.0/ 100
METRIC RATING
276th/ 347
METRIC RANK
16.1%
CHILD POVERTY AMONG BOYS UNDER 16
69.6/ 100
METRIC RATING
162nd/ 347
METRIC RANK
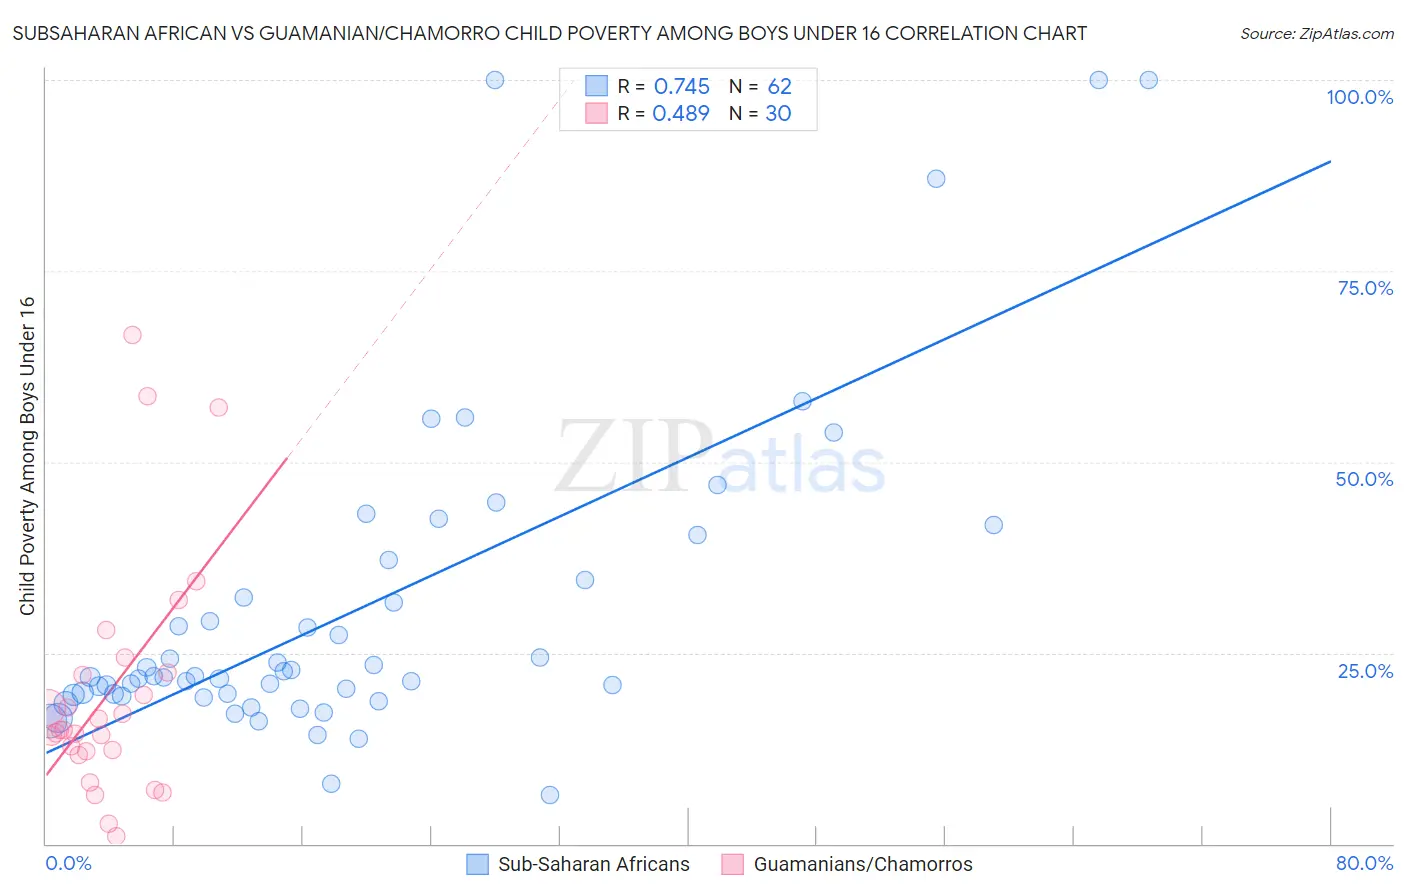
Subsaharan African vs Guamanian/Chamorro Child Poverty Among Boys Under 16 Correlation Chart
The statistical analysis conducted on geographies consisting of 497,613,414 people shows a strong positive correlation between the proportion of Sub-Saharan Africans and poverty level among boys under the age of 16 in the United States with a correlation coefficient (R) of 0.745 and weighted average of 20.0%. Similarly, the statistical analysis conducted on geographies consisting of 220,488,068 people shows a moderate positive correlation between the proportion of Guamanians/Chamorros and poverty level among boys under the age of 16 in the United States with a correlation coefficient (R) of 0.489 and weighted average of 16.1%, a difference of 24.5%.
Child Poverty Among Boys Under 16 Correlation Summary
| Measurement | Subsaharan African | Guamanian/Chamorro |
| Minimum | 6.5% | 1.0% |
| Maximum | 100.0% | 66.7% |
| Range | 93.5% | 65.6% |
| Mean | 30.6% | 20.1% |
| Median | 21.9% | 14.9% |
| Interquartile 25% (IQ1) | 19.4% | 12.0% |
| Interquartile 75% (IQ3) | 34.6% | 22.4% |
| Interquartile Range (IQR) | 15.2% | 10.3% |
| Standard Deviation (Sample) | 21.0% | 15.8% |
| Standard Deviation (Population) | 20.8% | 15.6% |
Similar Demographics by Child Poverty Among Boys Under 16
Demographics Similar to Sub-Saharan Africans by Child Poverty Among Boys Under 16
In terms of child poverty among boys under 16, the demographic groups most similar to Sub-Saharan Africans are Immigrants from Barbados (20.0%, a difference of 0.10%), Immigrants from West Indies (20.0%, a difference of 0.12%), Jamaican (20.0%, a difference of 0.17%), Bangladeshi (20.0%, a difference of 0.25%), and Immigrants from Bangladesh (19.9%, a difference of 0.29%).
| Demographics | Rating | Rank | Child Poverty Among Boys Under 16 |
| Immigrants | Cabo Verde | 0.1 /100 | #269 | Tragic 19.7% |
| Cherokee | 0.1 /100 | #270 | Tragic 19.7% |
| Chickasaw | 0.1 /100 | #271 | Tragic 19.8% |
| Immigrants | Ecuador | 0.1 /100 | #272 | Tragic 19.8% |
| Belizeans | 0.1 /100 | #273 | Tragic 19.9% |
| Immigrants | Bangladesh | 0.0 /100 | #274 | Tragic 19.9% |
| Jamaicans | 0.0 /100 | #275 | Tragic 20.0% |
| Sub-Saharan Africans | 0.0 /100 | #276 | Tragic 20.0% |
| Immigrants | Barbados | 0.0 /100 | #277 | Tragic 20.0% |
| Immigrants | West Indies | 0.0 /100 | #278 | Tragic 20.0% |
| Bangladeshis | 0.0 /100 | #279 | Tragic 20.0% |
| Central Americans | 0.0 /100 | #280 | Tragic 20.1% |
| Immigrants | Zaire | 0.0 /100 | #281 | Tragic 20.1% |
| Comanche | 0.0 /100 | #282 | Tragic 20.1% |
| Immigrants | Jamaica | 0.0 /100 | #283 | Tragic 20.1% |
Demographics Similar to Guamanians/Chamorros by Child Poverty Among Boys Under 16
In terms of child poverty among boys under 16, the demographic groups most similar to Guamanians/Chamorros are Costa Rican (16.1%, a difference of 0.20%), Immigrants from Albania (16.1%, a difference of 0.22%), Immigrants from Oceania (16.0%, a difference of 0.23%), Immigrants from Northern Africa (16.0%, a difference of 0.24%), and Colombian (16.1%, a difference of 0.58%).
| Demographics | Rating | Rank | Child Poverty Among Boys Under 16 |
| French Canadians | 76.6 /100 | #155 | Good 15.9% |
| Israelis | 76.5 /100 | #156 | Good 15.9% |
| Immigrants | Nepal | 76.0 /100 | #157 | Good 15.9% |
| Yugoslavians | 75.9 /100 | #158 | Good 15.9% |
| Immigrants | Chile | 74.8 /100 | #159 | Good 15.9% |
| Immigrants | Northern Africa | 71.3 /100 | #160 | Good 16.0% |
| Immigrants | Oceania | 71.3 /100 | #161 | Good 16.0% |
| Guamanians/Chamorros | 69.6 /100 | #162 | Good 16.1% |
| Costa Ricans | 68.1 /100 | #163 | Good 16.1% |
| Immigrants | Albania | 67.9 /100 | #164 | Good 16.1% |
| Colombians | 65.2 /100 | #165 | Good 16.1% |
| Immigrants | Germany | 63.6 /100 | #166 | Good 16.2% |
| Afghans | 55.4 /100 | #167 | Average 16.3% |
| South Americans | 55.3 /100 | #168 | Average 16.3% |
| Immigrants | Saudi Arabia | 53.6 /100 | #169 | Average 16.4% |