Subsaharan African vs Vietnamese Child Poverty Among Boys Under 16
COMPARE
Subsaharan African
Vietnamese
Child Poverty Among Boys Under 16
Child Poverty Among Boys Under 16 Comparison
Sub-Saharan Africans
Vietnamese
20.0%
CHILD POVERTY AMONG BOYS UNDER 16
0.0/ 100
METRIC RATING
276th/ 347
METRIC RANK
19.6%
CHILD POVERTY AMONG BOYS UNDER 16
0.1/ 100
METRIC RATING
267th/ 347
METRIC RANK
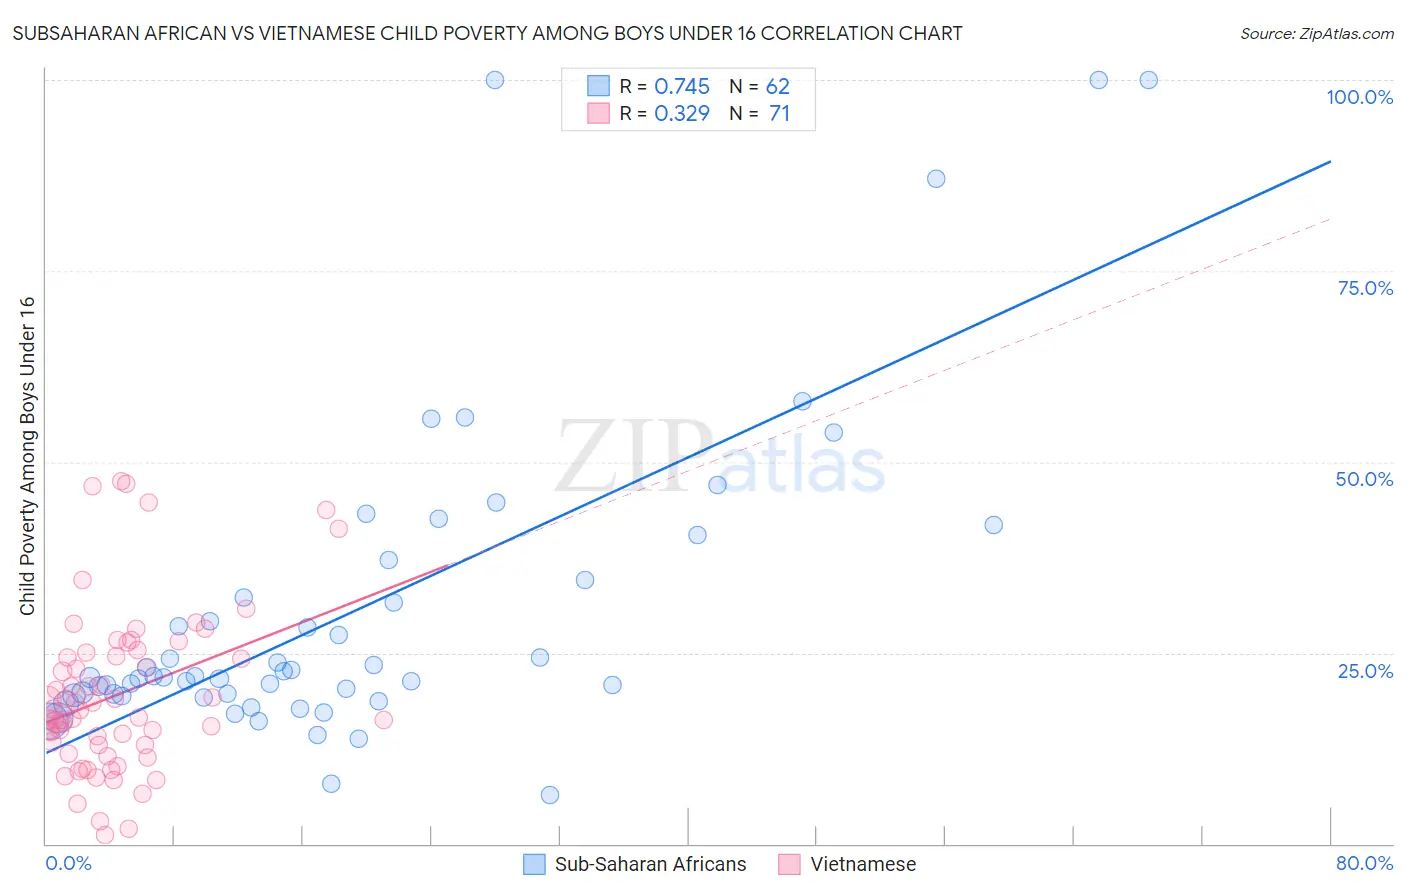
Subsaharan African vs Vietnamese Child Poverty Among Boys Under 16 Correlation Chart
The statistical analysis conducted on geographies consisting of 497,613,414 people shows a strong positive correlation between the proportion of Sub-Saharan Africans and poverty level among boys under the age of 16 in the United States with a correlation coefficient (R) of 0.745 and weighted average of 20.0%. Similarly, the statistical analysis conducted on geographies consisting of 169,843,059 people shows a mild positive correlation between the proportion of Vietnamese and poverty level among boys under the age of 16 in the United States with a correlation coefficient (R) of 0.329 and weighted average of 19.6%, a difference of 2.0%.
Child Poverty Among Boys Under 16 Correlation Summary
| Measurement | Subsaharan African | Vietnamese |
| Minimum | 6.5% | 1.2% |
| Maximum | 100.0% | 47.5% |
| Range | 93.5% | 46.4% |
| Mean | 30.6% | 19.5% |
| Median | 21.9% | 17.5% |
| Interquartile 25% (IQ1) | 19.4% | 12.9% |
| Interquartile 75% (IQ3) | 34.6% | 25.0% |
| Interquartile Range (IQR) | 15.2% | 12.1% |
| Standard Deviation (Sample) | 21.0% | 10.6% |
| Standard Deviation (Population) | 20.8% | 10.5% |
Demographics Similar to Sub-Saharan Africans and Vietnamese by Child Poverty Among Boys Under 16
In terms of child poverty among boys under 16, the demographic groups most similar to Sub-Saharan Africans are Immigrants from Barbados (20.0%, a difference of 0.10%), Immigrants from West Indies (20.0%, a difference of 0.12%), Jamaican (20.0%, a difference of 0.17%), Bangladeshi (20.0%, a difference of 0.25%), and Immigrants from Bangladesh (19.9%, a difference of 0.29%). Similarly, the demographic groups most similar to Vietnamese are Immigrants from El Salvador (19.6%, a difference of 0.010%), Guyanese (19.6%, a difference of 0.060%), Spanish American Indian (19.6%, a difference of 0.11%), Iroquois (19.6%, a difference of 0.15%), and Immigrants from Cabo Verde (19.7%, a difference of 0.27%).
| Demographics | Rating | Rank | Child Poverty Among Boys Under 16 |
| Immigrants | Ghana | 0.2 /100 | #261 | Tragic 19.4% |
| Immigrants | Guyana | 0.1 /100 | #262 | Tragic 19.5% |
| Ottawa | 0.1 /100 | #263 | Tragic 19.5% |
| Iroquois | 0.1 /100 | #264 | Tragic 19.6% |
| Guyanese | 0.1 /100 | #265 | Tragic 19.6% |
| Immigrants | El Salvador | 0.1 /100 | #266 | Tragic 19.6% |
| Vietnamese | 0.1 /100 | #267 | Tragic 19.6% |
| Spanish American Indians | 0.1 /100 | #268 | Tragic 19.6% |
| Immigrants | Cabo Verde | 0.1 /100 | #269 | Tragic 19.7% |
| Cherokee | 0.1 /100 | #270 | Tragic 19.7% |
| Chickasaw | 0.1 /100 | #271 | Tragic 19.8% |
| Immigrants | Ecuador | 0.1 /100 | #272 | Tragic 19.8% |
| Belizeans | 0.1 /100 | #273 | Tragic 19.9% |
| Immigrants | Bangladesh | 0.0 /100 | #274 | Tragic 19.9% |
| Jamaicans | 0.0 /100 | #275 | Tragic 20.0% |
| Sub-Saharan Africans | 0.0 /100 | #276 | Tragic 20.0% |
| Immigrants | Barbados | 0.0 /100 | #277 | Tragic 20.0% |
| Immigrants | West Indies | 0.0 /100 | #278 | Tragic 20.0% |
| Bangladeshis | 0.0 /100 | #279 | Tragic 20.0% |
| Central Americans | 0.0 /100 | #280 | Tragic 20.1% |
| Immigrants | Zaire | 0.0 /100 | #281 | Tragic 20.1% |