Immigrants from Senegal vs Assyrian/Chaldean/Syriac Child Poverty Among Boys Under 16
COMPARE
Immigrants from Senegal
Assyrian/Chaldean/Syriac
Child Poverty Among Boys Under 16
Child Poverty Among Boys Under 16 Comparison
Immigrants from Senegal
Assyrians/Chaldeans/Syriacs
20.7%
CHILD POVERTY AMONG BOYS UNDER 16
0.0/ 100
METRIC RATING
293rd/ 347
METRIC RANK
13.6%
CHILD POVERTY AMONG BOYS UNDER 16
99.8/ 100
METRIC RATING
34th/ 347
METRIC RANK
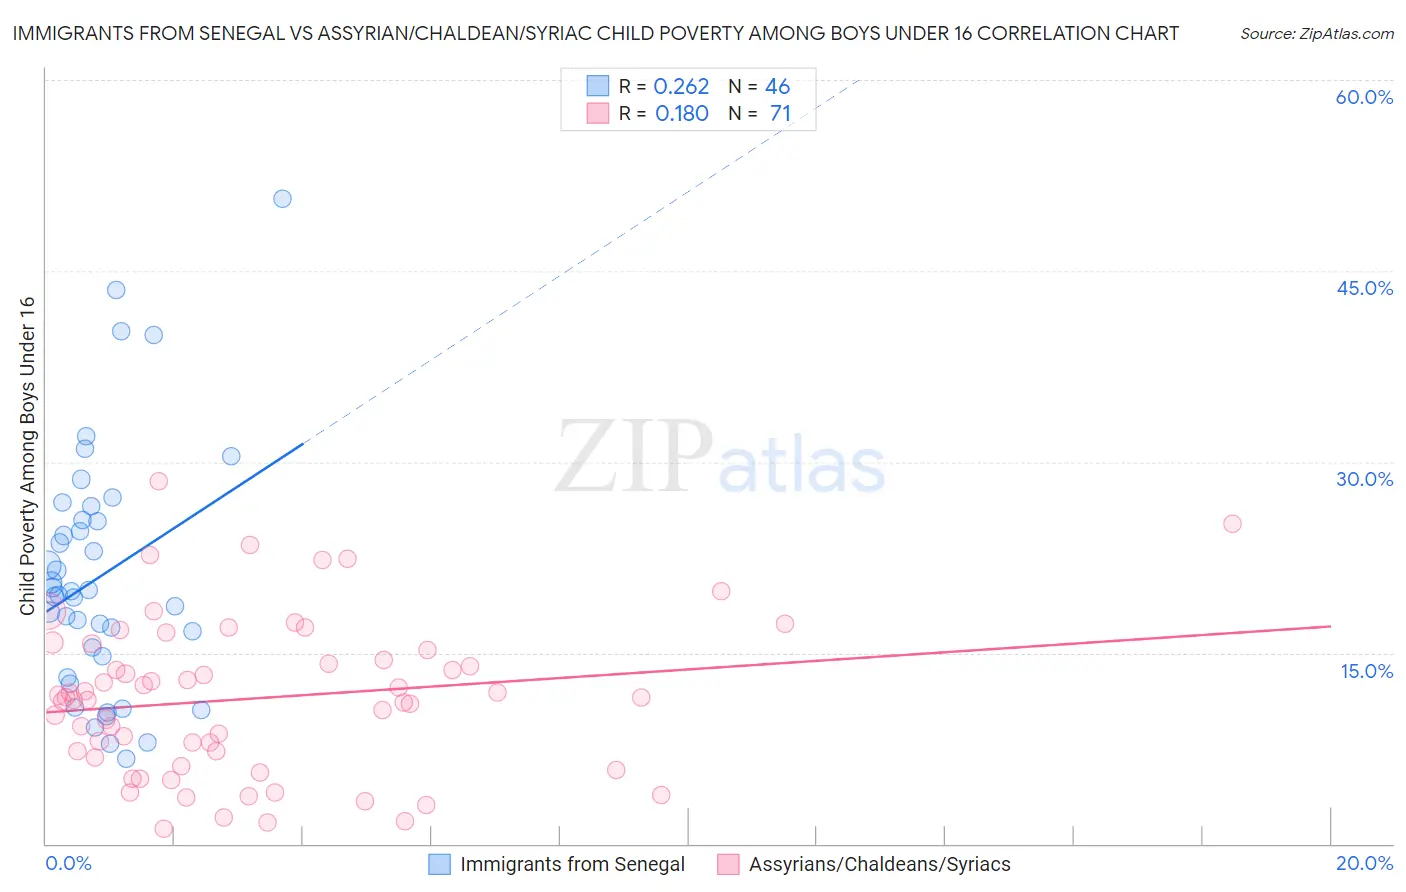
Immigrants from Senegal vs Assyrian/Chaldean/Syriac Child Poverty Among Boys Under 16 Correlation Chart
The statistical analysis conducted on geographies consisting of 89,864,954 people shows a weak positive correlation between the proportion of Immigrants from Senegal and poverty level among boys under the age of 16 in the United States with a correlation coefficient (R) of 0.262 and weighted average of 20.7%. Similarly, the statistical analysis conducted on geographies consisting of 109,529,261 people shows a poor positive correlation between the proportion of Assyrians/Chaldeans/Syriacs and poverty level among boys under the age of 16 in the United States with a correlation coefficient (R) of 0.180 and weighted average of 13.6%, a difference of 51.8%.
Child Poverty Among Boys Under 16 Correlation Summary
| Measurement | Immigrants from Senegal | Assyrian/Chaldean/Syriac |
| Minimum | 6.7% | 1.2% |
| Maximum | 50.7% | 28.5% |
| Range | 44.0% | 27.3% |
| Mean | 21.0% | 11.4% |
| Median | 19.7% | 11.5% |
| Interquartile 25% (IQ1) | 14.7% | 6.7% |
| Interquartile 75% (IQ3) | 25.5% | 15.2% |
| Interquartile Range (IQR) | 10.7% | 8.4% |
| Standard Deviation (Sample) | 9.7% | 6.1% |
| Standard Deviation (Population) | 9.6% | 6.0% |
Similar Demographics by Child Poverty Among Boys Under 16
Demographics Similar to Immigrants from Senegal by Child Poverty Among Boys Under 16
In terms of child poverty among boys under 16, the demographic groups most similar to Immigrants from Senegal are Yaqui (20.7%, a difference of 0.010%), Immigrants from Bahamas (20.7%, a difference of 0.11%), Mexican (20.7%, a difference of 0.24%), Immigrants from Latin America (20.6%, a difference of 0.27%), and Indonesian (20.8%, a difference of 0.44%).
| Demographics | Rating | Rank | Child Poverty Among Boys Under 16 |
| West Indians | 0.0 /100 | #286 | Tragic 20.3% |
| Immigrants | Belize | 0.0 /100 | #287 | Tragic 20.3% |
| Immigrants | St. Vincent and the Grenadines | 0.0 /100 | #288 | Tragic 20.3% |
| Blackfeet | 0.0 /100 | #289 | Tragic 20.4% |
| Senegalese | 0.0 /100 | #290 | Tragic 20.6% |
| Immigrants | Latin America | 0.0 /100 | #291 | Tragic 20.6% |
| Yaqui | 0.0 /100 | #292 | Tragic 20.7% |
| Immigrants | Senegal | 0.0 /100 | #293 | Tragic 20.7% |
| Immigrants | Bahamas | 0.0 /100 | #294 | Tragic 20.7% |
| Mexicans | 0.0 /100 | #295 | Tragic 20.7% |
| Indonesians | 0.0 /100 | #296 | Tragic 20.8% |
| Hispanics or Latinos | 0.0 /100 | #297 | Tragic 20.9% |
| Chippewa | 0.0 /100 | #298 | Tragic 21.0% |
| Immigrants | Caribbean | 0.0 /100 | #299 | Tragic 21.0% |
| Haitians | 0.0 /100 | #300 | Tragic 21.0% |
Demographics Similar to Assyrians/Chaldeans/Syriacs by Child Poverty Among Boys Under 16
In terms of child poverty among boys under 16, the demographic groups most similar to Assyrians/Chaldeans/Syriacs are Danish (13.6%, a difference of 0.11%), Immigrants from China (13.6%, a difference of 0.29%), Turkish (13.6%, a difference of 0.38%), Swedish (13.6%, a difference of 0.46%), and Cypriot (13.6%, a difference of 0.55%).
| Demographics | Rating | Rank | Child Poverty Among Boys Under 16 |
| Asians | 99.8 /100 | #27 | Exceptional 13.5% |
| Eastern Europeans | 99.8 /100 | #28 | Exceptional 13.5% |
| Cypriots | 99.8 /100 | #29 | Exceptional 13.6% |
| Swedes | 99.8 /100 | #30 | Exceptional 13.6% |
| Turks | 99.8 /100 | #31 | Exceptional 13.6% |
| Immigrants | China | 99.8 /100 | #32 | Exceptional 13.6% |
| Danes | 99.8 /100 | #33 | Exceptional 13.6% |
| Assyrians/Chaldeans/Syriacs | 99.8 /100 | #34 | Exceptional 13.6% |
| Russians | 99.7 /100 | #35 | Exceptional 13.8% |
| Luxembourgers | 99.7 /100 | #36 | Exceptional 13.8% |
| Immigrants | Sri Lanka | 99.6 /100 | #37 | Exceptional 13.9% |
| Immigrants | Northern Europe | 99.6 /100 | #38 | Exceptional 13.9% |
| Immigrants | Australia | 99.6 /100 | #39 | Exceptional 13.9% |
| Immigrants | Asia | 99.6 /100 | #40 | Exceptional 13.9% |
| Lithuanians | 99.6 /100 | #41 | Exceptional 14.0% |