Subsaharan African vs Assyrian/Chaldean/Syriac Unemployment Among Ages 20 to 24 years
COMPARE
Subsaharan African
Assyrian/Chaldean/Syriac
Unemployment Among Ages 20 to 24 years
Unemployment Among Ages 20 to 24 years Comparison
Sub-Saharan Africans
Assyrians/Chaldeans/Syriacs
11.1%
UNEMPLOYMENT AMONG AGES 20 TO 24 YEARS
0.0/ 100
METRIC RATING
264th/ 347
METRIC RANK
9.9%
UNEMPLOYMENT AMONG AGES 20 TO 24 YEARS
98.3/ 100
METRIC RATING
78th/ 347
METRIC RANK
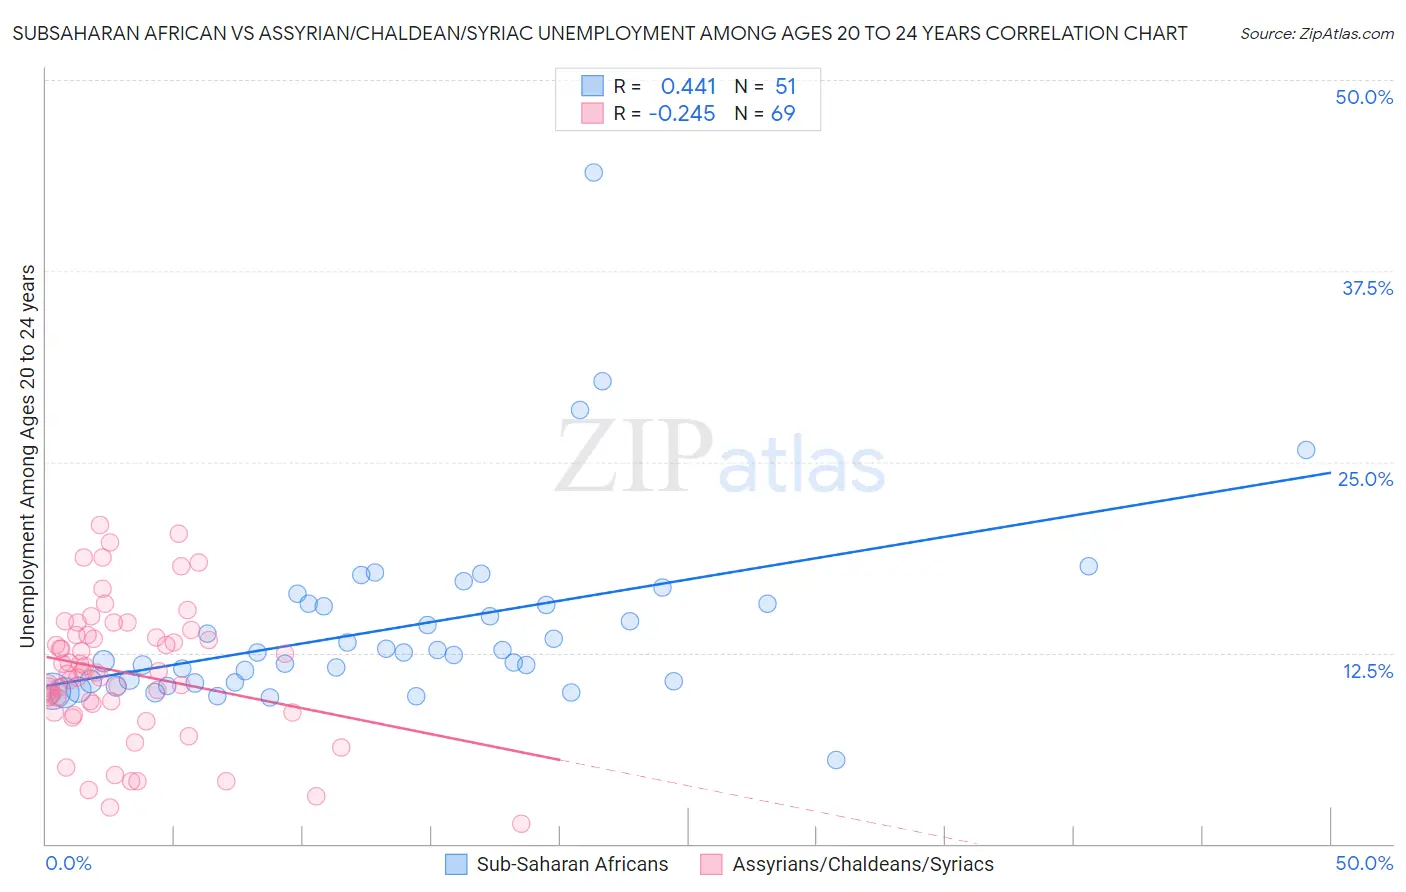
Subsaharan African vs Assyrian/Chaldean/Syriac Unemployment Among Ages 20 to 24 years Correlation Chart
The statistical analysis conducted on geographies consisting of 484,655,808 people shows a moderate positive correlation between the proportion of Sub-Saharan Africans and unemployment rate among population between the ages 20 and 24 in the United States with a correlation coefficient (R) of 0.441 and weighted average of 11.1%. Similarly, the statistical analysis conducted on geographies consisting of 109,491,073 people shows a weak negative correlation between the proportion of Assyrians/Chaldeans/Syriacs and unemployment rate among population between the ages 20 and 24 in the United States with a correlation coefficient (R) of -0.245 and weighted average of 9.9%, a difference of 11.6%.
Unemployment Among Ages 20 to 24 years Correlation Summary
| Measurement | Subsaharan African | Assyrian/Chaldean/Syriac |
| Minimum | 5.5% | 1.3% |
| Maximum | 43.9% | 20.8% |
| Range | 38.4% | 19.5% |
| Mean | 14.2% | 11.2% |
| Median | 12.5% | 11.2% |
| Interquartile 25% (IQ1) | 10.5% | 8.9% |
| Interquartile 75% (IQ3) | 15.7% | 13.7% |
| Interquartile Range (IQR) | 5.2% | 4.8% |
| Standard Deviation (Sample) | 6.3% | 4.4% |
| Standard Deviation (Population) | 6.2% | 4.3% |
Similar Demographics by Unemployment Among Ages 20 to 24 years
Demographics Similar to Sub-Saharan Africans by Unemployment Among Ages 20 to 24 years
In terms of unemployment among ages 20 to 24 years, the demographic groups most similar to Sub-Saharan Africans are Immigrants from Ireland (11.1%, a difference of 0.070%), Immigrants from Liberia (11.1%, a difference of 0.16%), Immigrants from Greece (11.1%, a difference of 0.44%), Marshallese (11.0%, a difference of 0.75%), and Maltese (11.2%, a difference of 0.89%).
| Demographics | Rating | Rank | Unemployment Among Ages 20 to 24 years |
| Immigrants | Western Asia | 0.3 /100 | #257 | Tragic 10.9% |
| Dutch West Indians | 0.3 /100 | #258 | Tragic 10.9% |
| Panamanians | 0.2 /100 | #259 | Tragic 10.9% |
| Immigrants | Lebanon | 0.2 /100 | #260 | Tragic 10.9% |
| Puget Sound Salish | 0.2 /100 | #261 | Tragic 10.9% |
| Immigrants | Latin America | 0.1 /100 | #262 | Tragic 11.0% |
| Marshallese | 0.1 /100 | #263 | Tragic 11.0% |
| Sub-Saharan Africans | 0.0 /100 | #264 | Tragic 11.1% |
| Immigrants | Ireland | 0.0 /100 | #265 | Tragic 11.1% |
| Immigrants | Liberia | 0.0 /100 | #266 | Tragic 11.1% |
| Immigrants | Greece | 0.0 /100 | #267 | Tragic 11.1% |
| Maltese | 0.0 /100 | #268 | Tragic 11.2% |
| Ute | 0.0 /100 | #269 | Tragic 11.2% |
| Delaware | 0.0 /100 | #270 | Tragic 11.3% |
| Immigrants | Uzbekistan | 0.0 /100 | #271 | Tragic 11.4% |
Demographics Similar to Assyrians/Chaldeans/Syriacs by Unemployment Among Ages 20 to 24 years
In terms of unemployment among ages 20 to 24 years, the demographic groups most similar to Assyrians/Chaldeans/Syriacs are Icelander (9.9%, a difference of 0.020%), Chickasaw (9.9%, a difference of 0.030%), Czechoslovakian (9.9%, a difference of 0.050%), Immigrants from Netherlands (9.9%, a difference of 0.070%), and Immigrants from Australia (9.9%, a difference of 0.14%).
| Demographics | Rating | Rank | Unemployment Among Ages 20 to 24 years |
| Celtics | 98.9 /100 | #71 | Exceptional 9.9% |
| Bolivians | 98.9 /100 | #72 | Exceptional 9.9% |
| Kenyans | 98.7 /100 | #73 | Exceptional 9.9% |
| Immigrants | Laos | 98.7 /100 | #74 | Exceptional 9.9% |
| Immigrants | Australia | 98.6 /100 | #75 | Exceptional 9.9% |
| Czechoslovakians | 98.4 /100 | #76 | Exceptional 9.9% |
| Chickasaw | 98.4 /100 | #77 | Exceptional 9.9% |
| Assyrians/Chaldeans/Syriacs | 98.3 /100 | #78 | Exceptional 9.9% |
| Icelanders | 98.3 /100 | #79 | Exceptional 9.9% |
| Immigrants | Netherlands | 98.2 /100 | #80 | Exceptional 9.9% |
| Yaqui | 98.0 /100 | #81 | Exceptional 9.9% |
| Sri Lankans | 98.0 /100 | #82 | Exceptional 9.9% |
| Immigrants | Bulgaria | 98.0 /100 | #83 | Exceptional 9.9% |
| Latvians | 97.9 /100 | #84 | Exceptional 9.9% |
| New Zealanders | 97.8 /100 | #85 | Exceptional 9.9% |