Subsaharan African vs English Child Poverty Among Boys Under 16
COMPARE
Subsaharan African
English
Child Poverty Among Boys Under 16
Child Poverty Among Boys Under 16 Comparison
Sub-Saharan Africans
English
20.0%
CHILD POVERTY AMONG BOYS UNDER 16
0.0/ 100
METRIC RATING
276th/ 347
METRIC RANK
15.1%
CHILD POVERTY AMONG BOYS UNDER 16
94.3/ 100
METRIC RATING
110th/ 347
METRIC RANK
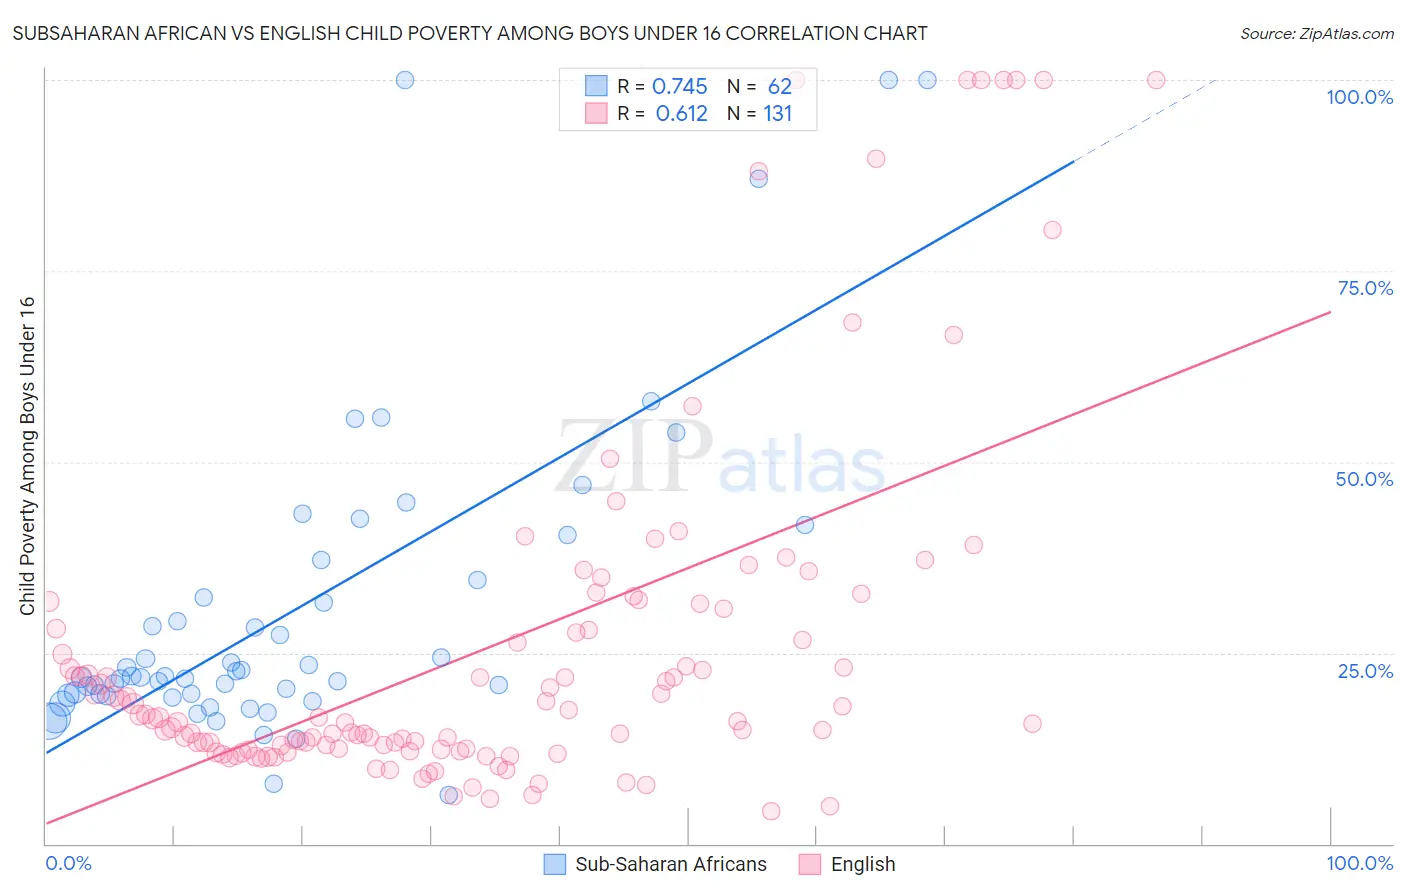
Subsaharan African vs English Child Poverty Among Boys Under 16 Correlation Chart
The statistical analysis conducted on geographies consisting of 497,613,414 people shows a strong positive correlation between the proportion of Sub-Saharan Africans and poverty level among boys under the age of 16 in the United States with a correlation coefficient (R) of 0.745 and weighted average of 20.0%. Similarly, the statistical analysis conducted on geographies consisting of 556,516,168 people shows a significant positive correlation between the proportion of English and poverty level among boys under the age of 16 in the United States with a correlation coefficient (R) of 0.612 and weighted average of 15.1%, a difference of 31.9%.
Child Poverty Among Boys Under 16 Correlation Summary
| Measurement | Subsaharan African | English |
| Minimum | 6.5% | 4.3% |
| Maximum | 100.0% | 100.0% |
| Range | 93.5% | 95.7% |
| Mean | 30.6% | 25.5% |
| Median | 21.9% | 16.4% |
| Interquartile 25% (IQ1) | 19.4% | 12.4% |
| Interquartile 75% (IQ3) | 34.6% | 28.2% |
| Interquartile Range (IQR) | 15.2% | 15.8% |
| Standard Deviation (Sample) | 21.0% | 23.3% |
| Standard Deviation (Population) | 20.8% | 23.2% |
Similar Demographics by Child Poverty Among Boys Under 16
Demographics Similar to Sub-Saharan Africans by Child Poverty Among Boys Under 16
In terms of child poverty among boys under 16, the demographic groups most similar to Sub-Saharan Africans are Immigrants from Barbados (20.0%, a difference of 0.10%), Immigrants from West Indies (20.0%, a difference of 0.12%), Jamaican (20.0%, a difference of 0.17%), Bangladeshi (20.0%, a difference of 0.25%), and Immigrants from Bangladesh (19.9%, a difference of 0.29%).
| Demographics | Rating | Rank | Child Poverty Among Boys Under 16 |
| Immigrants | Cabo Verde | 0.1 /100 | #269 | Tragic 19.7% |
| Cherokee | 0.1 /100 | #270 | Tragic 19.7% |
| Chickasaw | 0.1 /100 | #271 | Tragic 19.8% |
| Immigrants | Ecuador | 0.1 /100 | #272 | Tragic 19.8% |
| Belizeans | 0.1 /100 | #273 | Tragic 19.9% |
| Immigrants | Bangladesh | 0.0 /100 | #274 | Tragic 19.9% |
| Jamaicans | 0.0 /100 | #275 | Tragic 20.0% |
| Sub-Saharan Africans | 0.0 /100 | #276 | Tragic 20.0% |
| Immigrants | Barbados | 0.0 /100 | #277 | Tragic 20.0% |
| Immigrants | West Indies | 0.0 /100 | #278 | Tragic 20.0% |
| Bangladeshis | 0.0 /100 | #279 | Tragic 20.0% |
| Central Americans | 0.0 /100 | #280 | Tragic 20.1% |
| Immigrants | Zaire | 0.0 /100 | #281 | Tragic 20.1% |
| Comanche | 0.0 /100 | #282 | Tragic 20.1% |
| Immigrants | Jamaica | 0.0 /100 | #283 | Tragic 20.1% |
Demographics Similar to English by Child Poverty Among Boys Under 16
In terms of child poverty among boys under 16, the demographic groups most similar to English are Immigrants from Zimbabwe (15.2%, a difference of 0.050%), Basque (15.2%, a difference of 0.25%), Pakistani (15.1%, a difference of 0.26%), Irish (15.2%, a difference of 0.29%), and Immigrants from England (15.1%, a difference of 0.30%).
| Demographics | Rating | Rank | Child Poverty Among Boys Under 16 |
| Immigrants | Denmark | 95.6 /100 | #103 | Exceptional 15.0% |
| Immigrants | Switzerland | 95.4 /100 | #104 | Exceptional 15.0% |
| Dutch | 95.4 /100 | #105 | Exceptional 15.0% |
| Serbians | 95.2 /100 | #106 | Exceptional 15.1% |
| Jordanians | 95.1 /100 | #107 | Exceptional 15.1% |
| Immigrants | England | 94.8 /100 | #108 | Exceptional 15.1% |
| Pakistanis | 94.7 /100 | #109 | Exceptional 15.1% |
| English | 94.3 /100 | #110 | Exceptional 15.1% |
| Immigrants | Zimbabwe | 94.2 /100 | #111 | Exceptional 15.2% |
| Basques | 93.8 /100 | #112 | Exceptional 15.2% |
| Irish | 93.8 /100 | #113 | Exceptional 15.2% |
| Immigrants | Ukraine | 93.6 /100 | #114 | Exceptional 15.2% |
| Armenians | 93.6 /100 | #115 | Exceptional 15.2% |
| Immigrants | South Eastern Asia | 93.5 /100 | #116 | Exceptional 15.2% |
| Immigrants | Vietnam | 93.5 /100 | #117 | Exceptional 15.2% |