Subsaharan African vs Assyrian/Chaldean/Syriac Unemployment Among Ages 60 to 64 years
COMPARE
Subsaharan African
Assyrian/Chaldean/Syriac
Unemployment Among Ages 60 to 64 years
Unemployment Among Ages 60 to 64 years Comparison
Sub-Saharan Africans
Assyrians/Chaldeans/Syriacs
4.9%
UNEMPLOYMENT AMONG AGES 60 TO 64 YEARS
38.9/ 100
METRIC RATING
183rd/ 347
METRIC RANK
4.5%
UNEMPLOYMENT AMONG AGES 60 TO 64 YEARS
99.9/ 100
METRIC RATING
47th/ 347
METRIC RANK
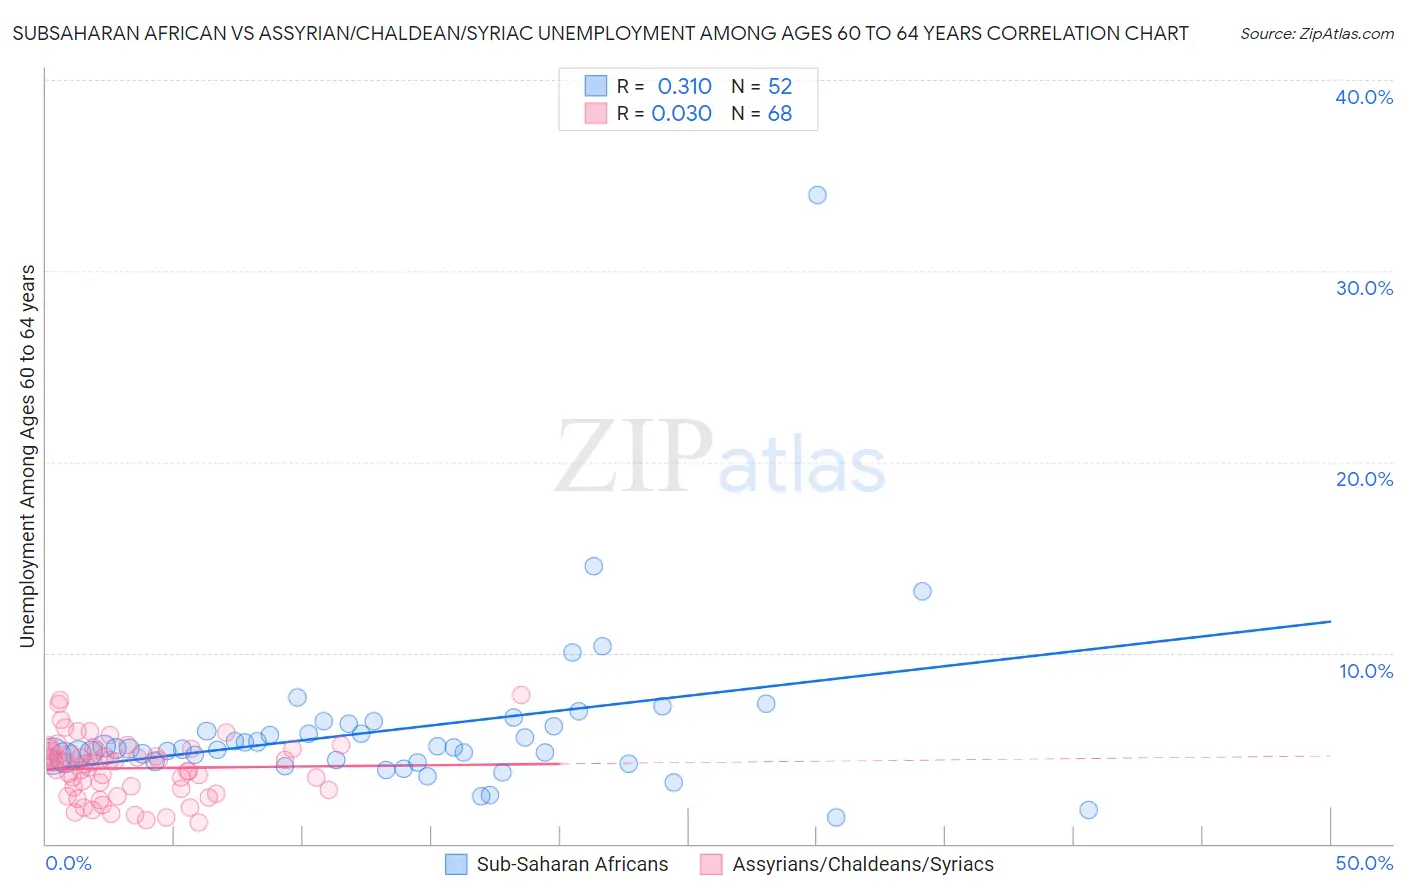
Subsaharan African vs Assyrian/Chaldean/Syriac Unemployment Among Ages 60 to 64 years Correlation Chart
The statistical analysis conducted on geographies consisting of 438,711,517 people shows a mild positive correlation between the proportion of Sub-Saharan Africans and unemployment rate among population between the ages 60 and 64 in the United States with a correlation coefficient (R) of 0.310 and weighted average of 4.9%. Similarly, the statistical analysis conducted on geographies consisting of 107,458,902 people shows no correlation between the proportion of Assyrians/Chaldeans/Syriacs and unemployment rate among population between the ages 60 and 64 in the United States with a correlation coefficient (R) of 0.030 and weighted average of 4.5%, a difference of 7.3%.
Unemployment Among Ages 60 to 64 years Correlation Summary
| Measurement | Subsaharan African | Assyrian/Chaldean/Syriac |
| Minimum | 1.4% | 1.1% |
| Maximum | 34.0% | 7.8% |
| Range | 32.6% | 6.7% |
| Mean | 6.0% | 4.0% |
| Median | 5.0% | 4.2% |
| Interquartile 25% (IQ1) | 4.4% | 2.9% |
| Interquartile 75% (IQ3) | 6.2% | 4.9% |
| Interquartile Range (IQR) | 1.8% | 2.1% |
| Standard Deviation (Sample) | 4.6% | 1.5% |
| Standard Deviation (Population) | 4.6% | 1.5% |
Similar Demographics by Unemployment Among Ages 60 to 64 years
Demographics Similar to Sub-Saharan Africans by Unemployment Among Ages 60 to 64 years
In terms of unemployment among ages 60 to 64 years, the demographic groups most similar to Sub-Saharan Africans are Sri Lankan (4.9%, a difference of 0.030%), Immigrants from Ukraine (4.9%, a difference of 0.050%), Ute (4.9%, a difference of 0.050%), Asian (4.9%, a difference of 0.070%), and Hungarian (4.9%, a difference of 0.070%).
| Demographics | Rating | Rank | Unemployment Among Ages 60 to 64 years |
| Bermudans | 46.5 /100 | #176 | Average 4.9% |
| Immigrants | Malaysia | 44.7 /100 | #177 | Average 4.9% |
| Immigrants | Nonimmigrants | 44.5 /100 | #178 | Average 4.9% |
| Immigrants | Sweden | 44.3 /100 | #179 | Average 4.9% |
| Asians | 40.8 /100 | #180 | Average 4.9% |
| Hungarians | 40.6 /100 | #181 | Average 4.9% |
| Sri Lankans | 39.8 /100 | #182 | Fair 4.9% |
| Sub-Saharan Africans | 38.9 /100 | #183 | Fair 4.9% |
| Immigrants | Ukraine | 37.6 /100 | #184 | Fair 4.9% |
| Ute | 37.4 /100 | #185 | Fair 4.9% |
| Spaniards | 35.8 /100 | #186 | Fair 4.9% |
| South American Indians | 31.2 /100 | #187 | Fair 4.9% |
| Nicaraguans | 30.4 /100 | #188 | Fair 4.9% |
| Immigrants | Nicaragua | 29.8 /100 | #189 | Fair 4.9% |
| Immigrants | Europe | 29.8 /100 | #190 | Fair 4.9% |
Demographics Similar to Assyrians/Chaldeans/Syriacs by Unemployment Among Ages 60 to 64 years
In terms of unemployment among ages 60 to 64 years, the demographic groups most similar to Assyrians/Chaldeans/Syriacs are Bhutanese (4.5%, a difference of 0.19%), Immigrants from Zimbabwe (4.6%, a difference of 0.22%), Liberian (4.5%, a difference of 0.27%), Scotch-Irish (4.6%, a difference of 0.27%), and Scottish (4.6%, a difference of 0.30%).
| Demographics | Rating | Rank | Unemployment Among Ages 60 to 64 years |
| Scandinavians | 100.0 /100 | #40 | Exceptional 4.5% |
| Immigrants | Sudan | 100.0 /100 | #41 | Exceptional 4.5% |
| English | 100.0 /100 | #42 | Exceptional 4.5% |
| Swedes | 100.0 /100 | #43 | Exceptional 4.5% |
| Europeans | 100.0 /100 | #44 | Exceptional 4.5% |
| Liberians | 99.9 /100 | #45 | Exceptional 4.5% |
| Bhutanese | 99.9 /100 | #46 | Exceptional 4.5% |
| Assyrians/Chaldeans/Syriacs | 99.9 /100 | #47 | Exceptional 4.5% |
| Immigrants | Zimbabwe | 99.9 /100 | #48 | Exceptional 4.6% |
| Scotch-Irish | 99.9 /100 | #49 | Exceptional 4.6% |
| Scottish | 99.9 /100 | #50 | Exceptional 4.6% |
| Immigrants | Kenya | 99.9 /100 | #51 | Exceptional 4.6% |
| Kenyans | 99.9 /100 | #52 | Exceptional 4.6% |
| Immigrants | Moldova | 99.9 /100 | #53 | Exceptional 4.6% |
| Dutch | 99.9 /100 | #54 | Exceptional 4.6% |