Subsaharan African vs Assyrian/Chaldean/Syriac Unemployment Among Ages 45 to 54 years
COMPARE
Subsaharan African
Assyrian/Chaldean/Syriac
Unemployment Among Ages 45 to 54 years
Unemployment Among Ages 45 to 54 years Comparison
Sub-Saharan Africans
Assyrians/Chaldeans/Syriacs
4.9%
UNEMPLOYMENT AMONG AGES 45 TO 54 YEARS
0.2/ 100
METRIC RATING
258th/ 347
METRIC RANK
4.7%
UNEMPLOYMENT AMONG AGES 45 TO 54 YEARS
3.5/ 100
METRIC RATING
226th/ 347
METRIC RANK
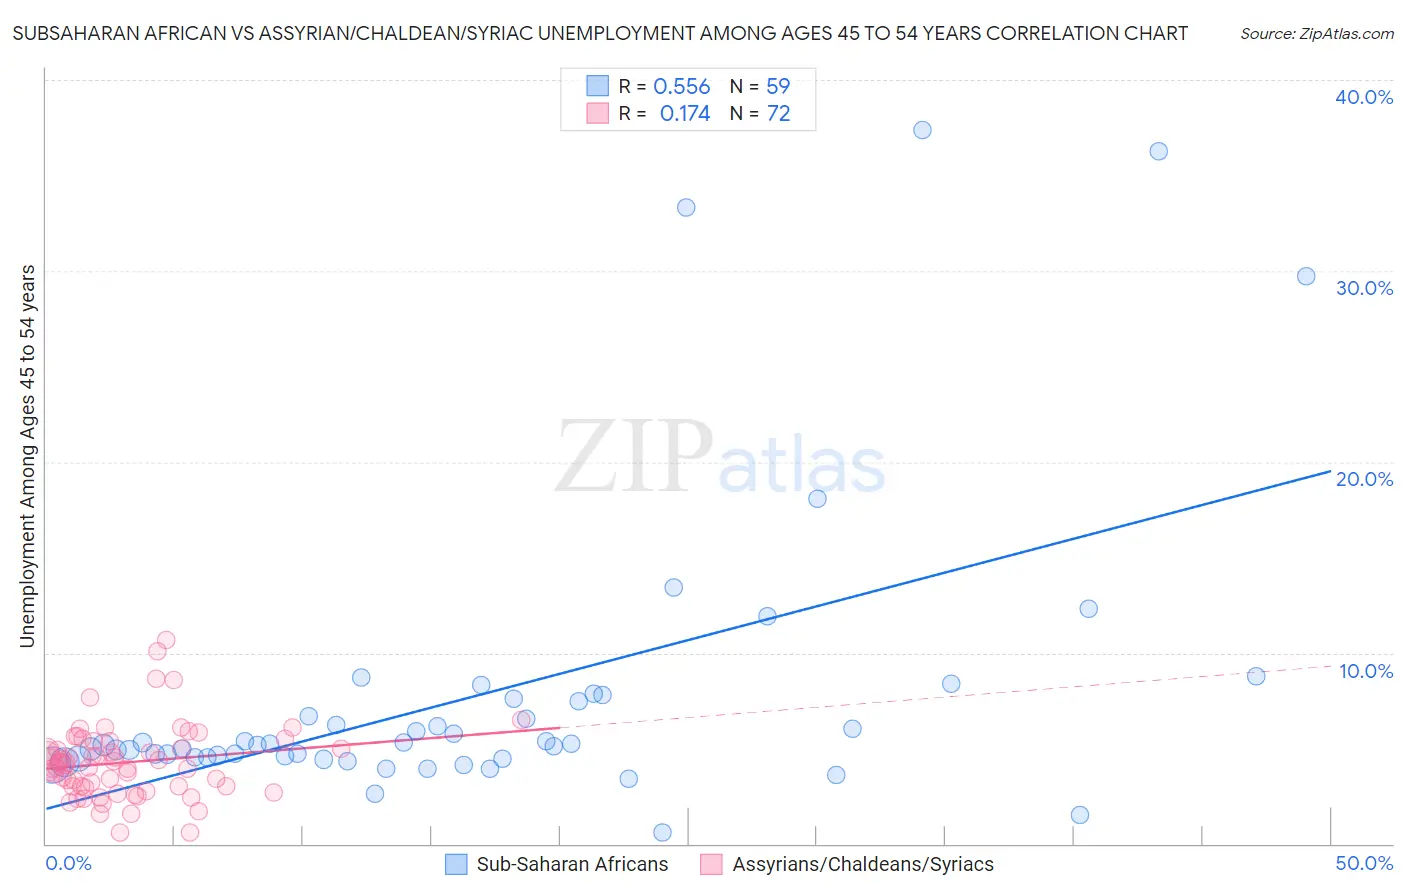
Subsaharan African vs Assyrian/Chaldean/Syriac Unemployment Among Ages 45 to 54 years Correlation Chart
The statistical analysis conducted on geographies consisting of 486,803,720 people shows a substantial positive correlation between the proportion of Sub-Saharan Africans and unemployment rate among population between the ages 45 and 54 in the United States with a correlation coefficient (R) of 0.556 and weighted average of 4.9%. Similarly, the statistical analysis conducted on geographies consisting of 109,531,563 people shows a poor positive correlation between the proportion of Assyrians/Chaldeans/Syriacs and unemployment rate among population between the ages 45 and 54 in the United States with a correlation coefficient (R) of 0.174 and weighted average of 4.7%, a difference of 3.4%.
Unemployment Among Ages 45 to 54 years Correlation Summary
| Measurement | Subsaharan African | Assyrian/Chaldean/Syriac |
| Minimum | 0.60% | 0.60% |
| Maximum | 37.4% | 10.7% |
| Range | 36.8% | 10.1% |
| Mean | 7.8% | 4.3% |
| Median | 5.2% | 4.2% |
| Interquartile 25% (IQ1) | 4.5% | 3.0% |
| Interquartile 75% (IQ3) | 7.6% | 5.2% |
| Interquartile Range (IQR) | 3.1% | 2.2% |
| Standard Deviation (Sample) | 7.7% | 1.9% |
| Standard Deviation (Population) | 7.7% | 1.9% |
Similar Demographics by Unemployment Among Ages 45 to 54 years
Demographics Similar to Sub-Saharan Africans by Unemployment Among Ages 45 to 54 years
In terms of unemployment among ages 45 to 54 years, the demographic groups most similar to Sub-Saharan Africans are Immigrants from Western Africa (4.9%, a difference of 0.030%), Ugandan (4.9%, a difference of 0.15%), Mexican American Indian (4.9%, a difference of 0.16%), Guatemalan (4.9%, a difference of 0.17%), and Immigrants from Western Asia (4.8%, a difference of 0.18%).
| Demographics | Rating | Rank | Unemployment Among Ages 45 to 54 years |
| Hondurans | 0.4 /100 | #251 | Tragic 4.8% |
| Immigrants | Bahamas | 0.3 /100 | #252 | Tragic 4.8% |
| Moroccans | 0.3 /100 | #253 | Tragic 4.8% |
| Immigrants | Lebanon | 0.2 /100 | #254 | Tragic 4.8% |
| Immigrants | El Salvador | 0.2 /100 | #255 | Tragic 4.8% |
| Immigrants | Western Asia | 0.2 /100 | #256 | Tragic 4.8% |
| Immigrants | Western Africa | 0.2 /100 | #257 | Tragic 4.9% |
| Sub-Saharan Africans | 0.2 /100 | #258 | Tragic 4.9% |
| Ugandans | 0.1 /100 | #259 | Tragic 4.9% |
| Mexican American Indians | 0.1 /100 | #260 | Tragic 4.9% |
| Guatemalans | 0.1 /100 | #261 | Tragic 4.9% |
| Mexicans | 0.1 /100 | #262 | Tragic 4.9% |
| Immigrants | Fiji | 0.1 /100 | #263 | Tragic 4.9% |
| Immigrants | Guatemala | 0.1 /100 | #264 | Tragic 4.9% |
| Immigrants | Somalia | 0.1 /100 | #265 | Tragic 4.9% |
Demographics Similar to Assyrians/Chaldeans/Syriacs by Unemployment Among Ages 45 to 54 years
In terms of unemployment among ages 45 to 54 years, the demographic groups most similar to Assyrians/Chaldeans/Syriacs are Iraqi (4.7%, a difference of 0.090%), South American Indian (4.7%, a difference of 0.12%), Immigrants from Israel (4.7%, a difference of 0.17%), Japanese (4.7%, a difference of 0.25%), and Immigrants from Ireland (4.7%, a difference of 0.29%).
| Demographics | Rating | Rank | Unemployment Among Ages 45 to 54 years |
| Nigerians | 7.0 /100 | #219 | Tragic 4.7% |
| Guamanians/Chamorros | 6.8 /100 | #220 | Tragic 4.7% |
| Choctaw | 6.1 /100 | #221 | Tragic 4.7% |
| Immigrants | Southern Europe | 6.0 /100 | #222 | Tragic 4.7% |
| Potawatomi | 5.7 /100 | #223 | Tragic 4.7% |
| Comanche | 4.8 /100 | #224 | Tragic 4.7% |
| Immigrants | Norway | 4.8 /100 | #225 | Tragic 4.7% |
| Assyrians/Chaldeans/Syriacs | 3.5 /100 | #226 | Tragic 4.7% |
| Iraqis | 3.2 /100 | #227 | Tragic 4.7% |
| South American Indians | 3.1 /100 | #228 | Tragic 4.7% |
| Immigrants | Israel | 3.0 /100 | #229 | Tragic 4.7% |
| Japanese | 2.8 /100 | #230 | Tragic 4.7% |
| Immigrants | Ireland | 2.7 /100 | #231 | Tragic 4.7% |
| Ottawa | 2.7 /100 | #232 | Tragic 4.7% |
| Immigrants | Immigrants | 2.6 /100 | #233 | Tragic 4.7% |