Spanish vs Marshallese Single Female Poverty
COMPARE
Spanish
Marshallese
Single Female Poverty
Single Female Poverty Comparison
Spanish
Marshallese
22.0%
SINGLE FEMALE POVERTY
4.7/ 100
METRIC RATING
234th/ 347
METRIC RANK
23.3%
SINGLE FEMALE POVERTY
0.1/ 100
METRIC RATING
274th/ 347
METRIC RANK
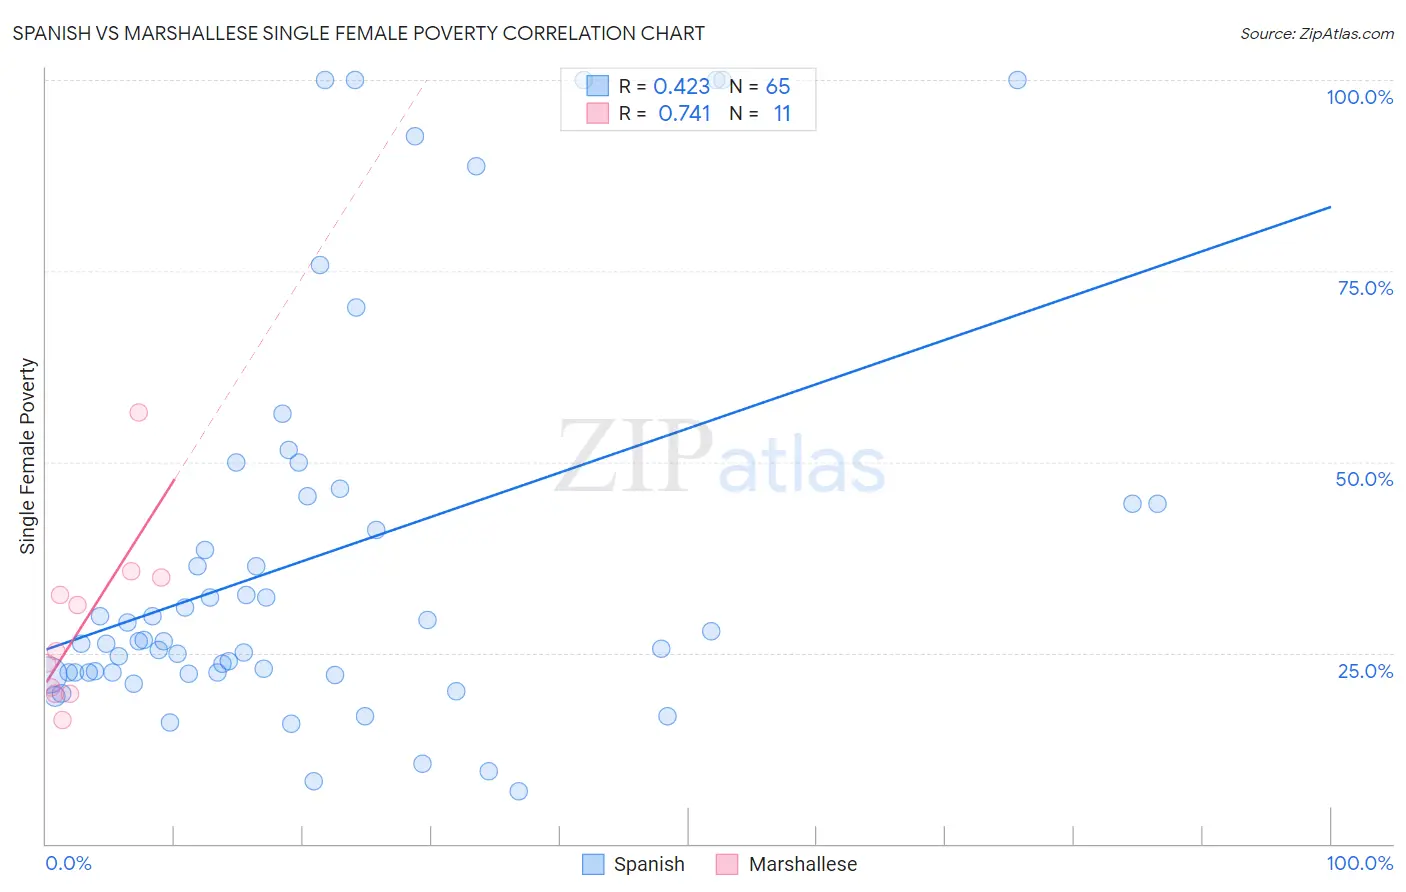
Spanish vs Marshallese Single Female Poverty Correlation Chart
The statistical analysis conducted on geographies consisting of 415,535,670 people shows a moderate positive correlation between the proportion of Spanish and poverty level among single females in the United States with a correlation coefficient (R) of 0.423 and weighted average of 22.0%. Similarly, the statistical analysis conducted on geographies consisting of 14,727,549 people shows a strong positive correlation between the proportion of Marshallese and poverty level among single females in the United States with a correlation coefficient (R) of 0.741 and weighted average of 23.3%, a difference of 5.9%.
Single Female Poverty Correlation Summary
| Measurement | Spanish | Marshallese |
| Minimum | 6.8% | 16.2% |
| Maximum | 100.0% | 56.5% |
| Range | 93.2% | 40.3% |
| Mean | 37.7% | 28.7% |
| Median | 26.5% | 25.2% |
| Interquartile 25% (IQ1) | 22.4% | 19.6% |
| Interquartile 75% (IQ3) | 45.0% | 34.8% |
| Interquartile Range (IQR) | 22.6% | 15.2% |
| Standard Deviation (Sample) | 26.1% | 11.4% |
| Standard Deviation (Population) | 25.9% | 10.9% |
Similar Demographics by Single Female Poverty
Demographics Similar to Spanish by Single Female Poverty
In terms of single female poverty, the demographic groups most similar to Spanish are Spaniard (22.0%, a difference of 0.0%), Dutch (22.0%, a difference of 0.020%), Immigrants from Thailand (22.0%, a difference of 0.10%), Welsh (22.0%, a difference of 0.11%), and Immigrants from Ecuador (22.0%, a difference of 0.18%).
| Demographics | Rating | Rank | Single Female Poverty |
| Immigrants | Ghana | 5.8 /100 | #227 | Tragic 21.9% |
| Salvadorans | 5.5 /100 | #228 | Tragic 21.9% |
| Tlingit-Haida | 5.4 /100 | #229 | Tragic 21.9% |
| Immigrants | Western Africa | 5.3 /100 | #230 | Tragic 22.0% |
| Welsh | 5.0 /100 | #231 | Tragic 22.0% |
| Immigrants | Thailand | 5.0 /100 | #232 | Tragic 22.0% |
| Spaniards | 4.7 /100 | #233 | Tragic 22.0% |
| Spanish | 4.7 /100 | #234 | Tragic 22.0% |
| Dutch | 4.6 /100 | #235 | Tragic 22.0% |
| Immigrants | Ecuador | 4.2 /100 | #236 | Tragic 22.0% |
| Vietnamese | 4.0 /100 | #237 | Tragic 22.0% |
| French Canadians | 2.8 /100 | #238 | Tragic 22.2% |
| Malaysians | 2.8 /100 | #239 | Tragic 22.2% |
| French | 2.3 /100 | #240 | Tragic 22.2% |
| Cape Verdeans | 2.1 /100 | #241 | Tragic 22.3% |
Demographics Similar to Marshallese by Single Female Poverty
In terms of single female poverty, the demographic groups most similar to Marshallese are Alaska Native (23.3%, a difference of 0.010%), Immigrants from Senegal (23.2%, a difference of 0.26%), Mexican American Indian (23.4%, a difference of 0.27%), Subsaharan African (23.2%, a difference of 0.45%), and Inupiat (23.1%, a difference of 0.69%).
| Demographics | Rating | Rank | Single Female Poverty |
| Senegalese | 0.2 /100 | #267 | Tragic 23.0% |
| Fijians | 0.2 /100 | #268 | Tragic 23.1% |
| Hmong | 0.2 /100 | #269 | Tragic 23.1% |
| Inupiat | 0.2 /100 | #270 | Tragic 23.1% |
| Sub-Saharan Africans | 0.1 /100 | #271 | Tragic 23.2% |
| Immigrants | Senegal | 0.1 /100 | #272 | Tragic 23.2% |
| Alaska Natives | 0.1 /100 | #273 | Tragic 23.3% |
| Marshallese | 0.1 /100 | #274 | Tragic 23.3% |
| Mexican American Indians | 0.1 /100 | #275 | Tragic 23.4% |
| Immigrants | Azores | 0.0 /100 | #276 | Tragic 23.5% |
| Pennsylvania Germans | 0.0 /100 | #277 | Tragic 23.6% |
| Immigrants | Nonimmigrants | 0.0 /100 | #278 | Tragic 23.6% |
| Alaskan Athabascans | 0.0 /100 | #279 | Tragic 23.6% |
| Immigrants | Latin America | 0.0 /100 | #280 | Tragic 23.7% |
| Immigrants | Zaire | 0.0 /100 | #281 | Tragic 23.8% |