Spanish American Indian vs Latvian Single Male Poverty
COMPARE
Spanish American Indian
Latvian
Single Male Poverty
Single Male Poverty Comparison
Spanish American Indians
Latvians
12.1%
SINGLE MALE POVERTY
98.0/ 100
METRIC RATING
92nd/ 347
METRIC RANK
12.7%
SINGLE MALE POVERTY
67.9/ 100
METRIC RATING
157th/ 347
METRIC RANK
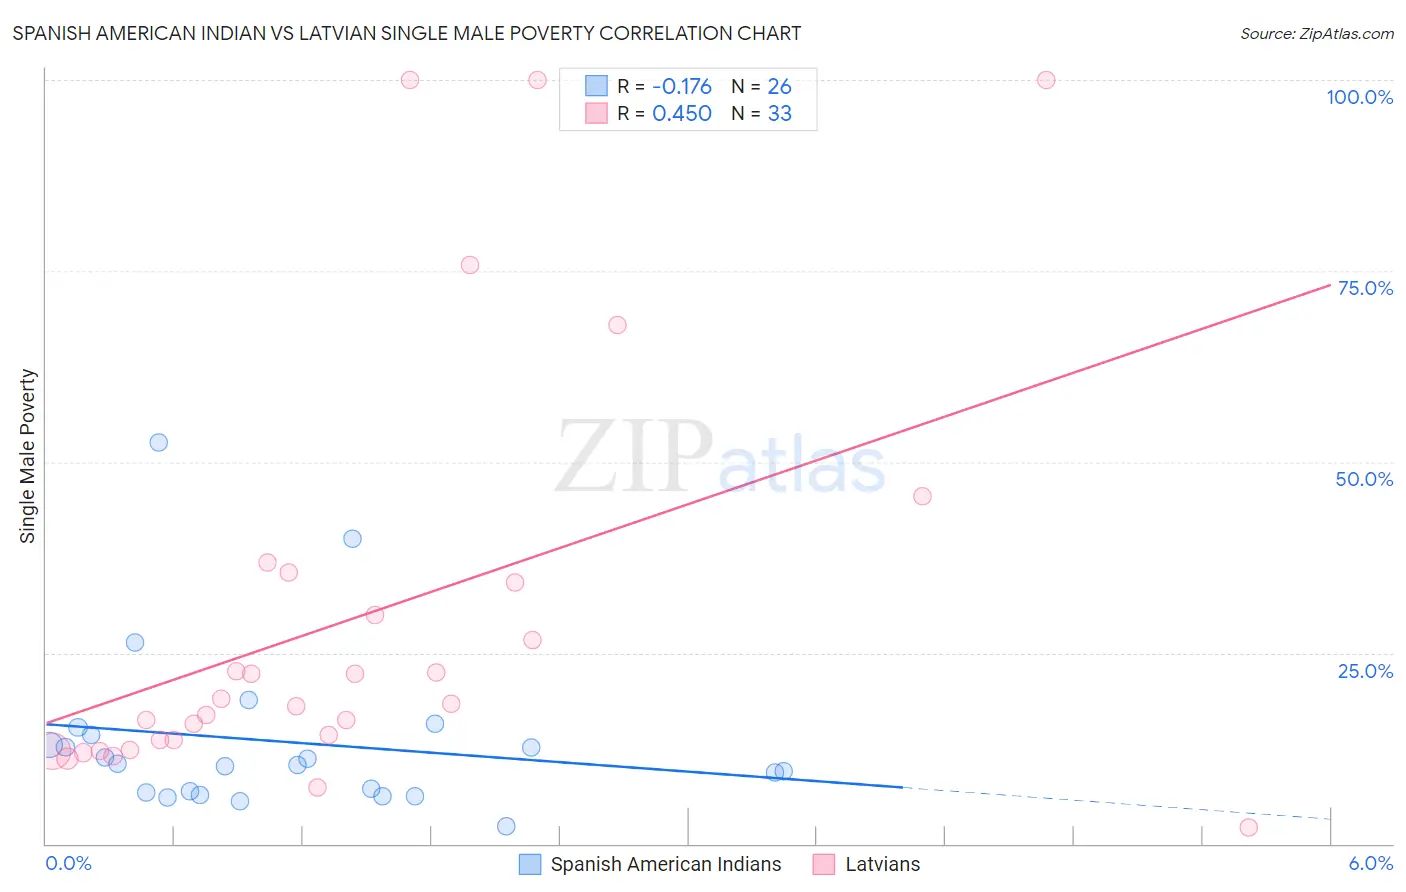
Spanish American Indian vs Latvian Single Male Poverty Correlation Chart
The statistical analysis conducted on geographies consisting of 71,838,653 people shows a poor negative correlation between the proportion of Spanish American Indians and poverty level among single males in the United States with a correlation coefficient (R) of -0.176 and weighted average of 12.1%. Similarly, the statistical analysis conducted on geographies consisting of 199,264,855 people shows a moderate positive correlation between the proportion of Latvians and poverty level among single males in the United States with a correlation coefficient (R) of 0.450 and weighted average of 12.7%, a difference of 4.4%.
Single Male Poverty Correlation Summary
| Measurement | Spanish American Indian | Latvian |
| Minimum | 2.3% | 2.2% |
| Maximum | 52.6% | 100.0% |
| Range | 50.3% | 97.8% |
| Mean | 13.4% | 29.8% |
| Median | 10.4% | 18.3% |
| Interquartile 25% (IQ1) | 6.8% | 13.0% |
| Interquartile 75% (IQ3) | 14.2% | 34.9% |
| Interquartile Range (IQR) | 7.4% | 21.9% |
| Standard Deviation (Sample) | 11.0% | 27.4% |
| Standard Deviation (Population) | 10.8% | 27.0% |
Similar Demographics by Single Male Poverty
Demographics Similar to Spanish American Indians by Single Male Poverty
In terms of single male poverty, the demographic groups most similar to Spanish American Indians are Immigrants from Bosnia and Herzegovina (12.1%, a difference of 0.060%), Immigrants from Turkey (12.1%, a difference of 0.11%), Immigrants from Ireland (12.1%, a difference of 0.16%), South American Indian (12.1%, a difference of 0.16%), and Colombian (12.2%, a difference of 0.18%).
| Demographics | Rating | Rank | Single Male Poverty |
| Turks | 98.5 /100 | #85 | Exceptional 12.1% |
| Immigrants | Israel | 98.5 /100 | #86 | Exceptional 12.1% |
| South Americans | 98.5 /100 | #87 | Exceptional 12.1% |
| Immigrants | Eritrea | 98.5 /100 | #88 | Exceptional 12.1% |
| Immigrants | Ireland | 98.3 /100 | #89 | Exceptional 12.1% |
| South American Indians | 98.3 /100 | #90 | Exceptional 12.1% |
| Immigrants | Turkey | 98.2 /100 | #91 | Exceptional 12.1% |
| Spanish American Indians | 98.0 /100 | #92 | Exceptional 12.1% |
| Immigrants | Bosnia and Herzegovina | 97.9 /100 | #93 | Exceptional 12.1% |
| Colombians | 97.8 /100 | #94 | Exceptional 12.2% |
| Mongolians | 97.7 /100 | #95 | Exceptional 12.2% |
| Immigrants | Sweden | 97.5 /100 | #96 | Exceptional 12.2% |
| Immigrants | Italy | 97.4 /100 | #97 | Exceptional 12.2% |
| Guamanians/Chamorros | 97.4 /100 | #98 | Exceptional 12.2% |
| Immigrants | Cuba | 97.3 /100 | #99 | Exceptional 12.2% |
Demographics Similar to Latvians by Single Male Poverty
In terms of single male poverty, the demographic groups most similar to Latvians are Vietnamese (12.7%, a difference of 0.0%), Immigrants from Spain (12.7%, a difference of 0.040%), Immigrants from Scotland (12.7%, a difference of 0.060%), Immigrants (12.7%, a difference of 0.13%), and Immigrants from Middle Africa (12.7%, a difference of 0.18%).
| Demographics | Rating | Rank | Single Male Poverty |
| Immigrants | Panama | 72.1 /100 | #150 | Good 12.6% |
| Immigrants | Hungary | 71.9 /100 | #151 | Good 12.6% |
| Australians | 71.4 /100 | #152 | Good 12.6% |
| Immigrants | Immigrants | 70.1 /100 | #153 | Good 12.7% |
| Immigrants | Scotland | 68.9 /100 | #154 | Good 12.7% |
| Immigrants | Spain | 68.7 /100 | #155 | Good 12.7% |
| Vietnamese | 67.9 /100 | #156 | Good 12.7% |
| Latvians | 67.9 /100 | #157 | Good 12.7% |
| Immigrants | Middle Africa | 64.9 /100 | #158 | Good 12.7% |
| Immigrants | Liberia | 64.2 /100 | #159 | Good 12.7% |
| Greeks | 64.1 /100 | #160 | Good 12.7% |
| Immigrants | Africa | 63.4 /100 | #161 | Good 12.7% |
| Eastern Europeans | 63.3 /100 | #162 | Good 12.7% |
| Palestinians | 63.1 /100 | #163 | Good 12.7% |
| Immigrants | Nigeria | 62.8 /100 | #164 | Good 12.7% |