Indian (Asian) vs Latvian Poverty
COMPARE
Indian (Asian)
Latvian
Poverty
Poverty Comparison
Indians (Asian)
Latvians
11.3%
POVERTY
96.6/ 100
METRIC RATING
80th/ 347
METRIC RANK
10.5%
POVERTY
99.8/ 100
METRIC RATING
18th/ 347
METRIC RANK
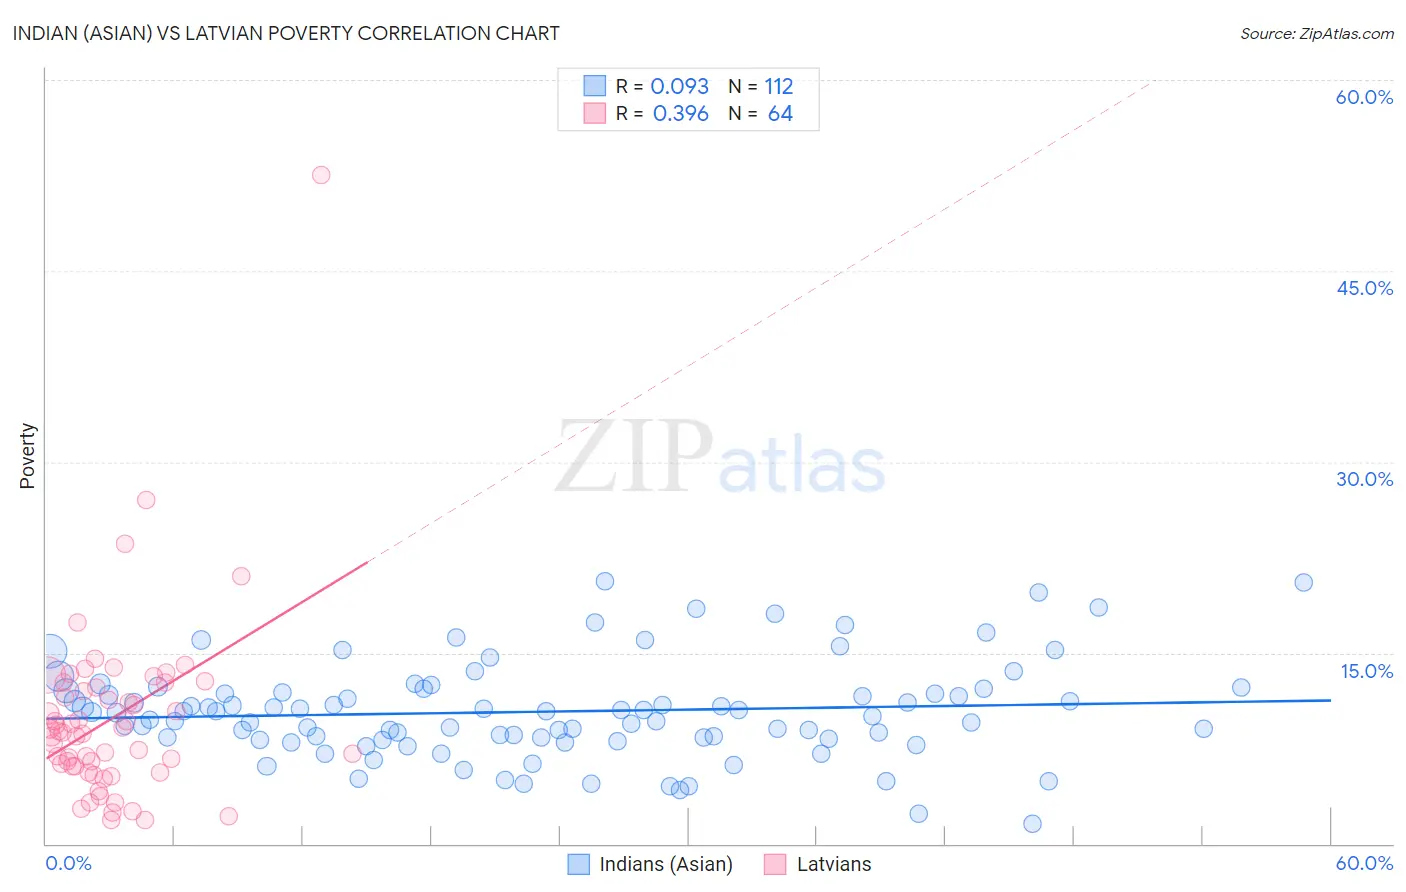
Indian (Asian) vs Latvian Poverty Correlation Chart
The statistical analysis conducted on geographies consisting of 494,774,105 people shows a slight positive correlation between the proportion of Indians (Asian) and poverty level in the United States with a correlation coefficient (R) of 0.093 and weighted average of 11.3%. Similarly, the statistical analysis conducted on geographies consisting of 220,650,145 people shows a mild positive correlation between the proportion of Latvians and poverty level in the United States with a correlation coefficient (R) of 0.396 and weighted average of 10.5%, a difference of 7.6%.
Poverty Correlation Summary
| Measurement | Indian (Asian) | Latvian |
| Minimum | 1.6% | 1.8% |
| Maximum | 20.6% | 52.6% |
| Range | 19.0% | 50.7% |
| Mean | 10.4% | 9.9% |
| Median | 10.3% | 8.8% |
| Interquartile 25% (IQ1) | 8.3% | 6.1% |
| Interquartile 75% (IQ3) | 12.0% | 12.5% |
| Interquartile Range (IQR) | 3.7% | 6.4% |
| Standard Deviation (Sample) | 3.8% | 7.3% |
| Standard Deviation (Population) | 3.7% | 7.3% |
Similar Demographics by Poverty
Demographics Similar to Indians (Asian) by Poverty
In terms of poverty, the demographic groups most similar to Indians (Asian) are Irish (11.3%, a difference of 0.0%), Cambodian (11.3%, a difference of 0.020%), Dutch (11.3%, a difference of 0.060%), Immigrants from Eastern Asia (11.3%, a difference of 0.080%), and Egyptian (11.3%, a difference of 0.10%).
| Demographics | Rating | Rank | Poverty |
| Immigrants | Belgium | 97.2 /100 | #73 | Exceptional 11.3% |
| Carpatho Rusyns | 97.2 /100 | #74 | Exceptional 11.3% |
| Immigrants | Eastern Europe | 97.0 /100 | #75 | Exceptional 11.3% |
| Immigrants | North America | 96.8 /100 | #76 | Exceptional 11.3% |
| Immigrants | Eastern Asia | 96.7 /100 | #77 | Exceptional 11.3% |
| Dutch | 96.7 /100 | #78 | Exceptional 11.3% |
| Cambodians | 96.7 /100 | #79 | Exceptional 11.3% |
| Indians (Asian) | 96.6 /100 | #80 | Exceptional 11.3% |
| Irish | 96.6 /100 | #81 | Exceptional 11.3% |
| Egyptians | 96.5 /100 | #82 | Exceptional 11.3% |
| Immigrants | Sweden | 96.3 /100 | #83 | Exceptional 11.3% |
| English | 96.3 /100 | #84 | Exceptional 11.3% |
| Immigrants | England | 96.2 /100 | #85 | Exceptional 11.4% |
| Jordanians | 96.0 /100 | #86 | Exceptional 11.4% |
| Northern Europeans | 96.0 /100 | #87 | Exceptional 11.4% |
Demographics Similar to Latvians by Poverty
In terms of poverty, the demographic groups most similar to Latvians are Norwegian (10.5%, a difference of 0.10%), Immigrants from Scotland (10.6%, a difference of 0.39%), Lithuanian (10.5%, a difference of 0.46%), Immigrants from North Macedonia (10.6%, a difference of 0.51%), and Luxembourger (10.6%, a difference of 0.58%).
| Demographics | Rating | Rank | Poverty |
| Immigrants | Lithuania | 99.9 /100 | #11 | Exceptional 10.3% |
| Bhutanese | 99.8 /100 | #12 | Exceptional 10.4% |
| Immigrants | Hong Kong | 99.8 /100 | #13 | Exceptional 10.4% |
| Immigrants | Bolivia | 99.8 /100 | #14 | Exceptional 10.4% |
| Bolivians | 99.8 /100 | #15 | Exceptional 10.4% |
| Lithuanians | 99.8 /100 | #16 | Exceptional 10.5% |
| Norwegians | 99.8 /100 | #17 | Exceptional 10.5% |
| Latvians | 99.8 /100 | #18 | Exceptional 10.5% |
| Immigrants | Scotland | 99.7 /100 | #19 | Exceptional 10.6% |
| Immigrants | North Macedonia | 99.7 /100 | #20 | Exceptional 10.6% |
| Luxembourgers | 99.7 /100 | #21 | Exceptional 10.6% |
| Eastern Europeans | 99.7 /100 | #22 | Exceptional 10.6% |
| Swedes | 99.7 /100 | #23 | Exceptional 10.6% |
| Italians | 99.7 /100 | #24 | Exceptional 10.6% |
| Croatians | 99.6 /100 | #25 | Exceptional 10.6% |