West Indian vs Latvian Poverty
COMPARE
West Indian
Latvian
Poverty
Poverty Comparison
West Indians
Latvians
15.0%
POVERTY
0.0/ 100
METRIC RATING
284th/ 347
METRIC RANK
10.5%
POVERTY
99.8/ 100
METRIC RATING
18th/ 347
METRIC RANK
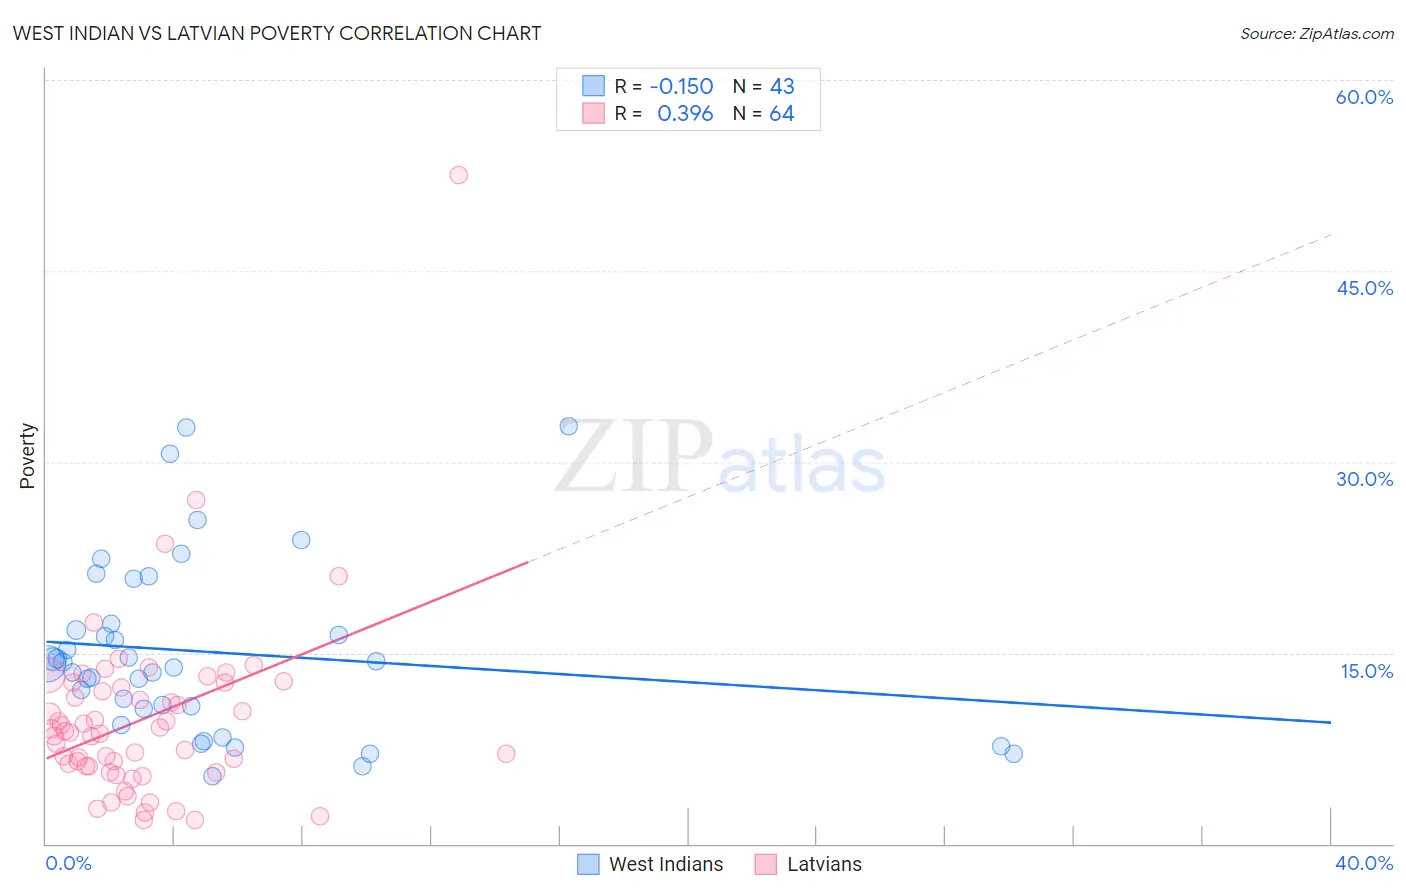
West Indian vs Latvian Poverty Correlation Chart
The statistical analysis conducted on geographies consisting of 253,897,912 people shows a poor negative correlation between the proportion of West Indians and poverty level in the United States with a correlation coefficient (R) of -0.150 and weighted average of 15.0%. Similarly, the statistical analysis conducted on geographies consisting of 220,650,145 people shows a mild positive correlation between the proportion of Latvians and poverty level in the United States with a correlation coefficient (R) of 0.396 and weighted average of 10.5%, a difference of 42.5%.
Poverty Correlation Summary
| Measurement | West Indian | Latvian |
| Minimum | 5.3% | 1.8% |
| Maximum | 32.8% | 52.6% |
| Range | 27.5% | 50.7% |
| Mean | 15.1% | 9.9% |
| Median | 14.1% | 8.8% |
| Interquartile 25% (IQ1) | 10.6% | 6.1% |
| Interquartile 75% (IQ3) | 17.3% | 12.5% |
| Interquartile Range (IQR) | 6.7% | 6.4% |
| Standard Deviation (Sample) | 6.9% | 7.3% |
| Standard Deviation (Population) | 6.8% | 7.3% |
Similar Demographics by Poverty
Demographics Similar to West Indians by Poverty
In terms of poverty, the demographic groups most similar to West Indians are Vietnamese (15.0%, a difference of 0.050%), Immigrants from Haiti (15.0%, a difference of 0.10%), Comanche (15.0%, a difference of 0.23%), Immigrants from Latin America (15.0%, a difference of 0.32%), and Inupiat (15.1%, a difference of 0.53%).
| Demographics | Rating | Rank | Poverty |
| Bangladeshis | 0.0 /100 | #277 | Tragic 14.8% |
| Belizeans | 0.0 /100 | #278 | Tragic 14.8% |
| Immigrants | St. Vincent and the Grenadines | 0.0 /100 | #279 | Tragic 14.9% |
| Haitians | 0.0 /100 | #280 | Tragic 14.9% |
| Immigrants | Barbados | 0.0 /100 | #281 | Tragic 14.9% |
| Comanche | 0.0 /100 | #282 | Tragic 15.0% |
| Immigrants | Haiti | 0.0 /100 | #283 | Tragic 15.0% |
| West Indians | 0.0 /100 | #284 | Tragic 15.0% |
| Vietnamese | 0.0 /100 | #285 | Tragic 15.0% |
| Immigrants | Latin America | 0.0 /100 | #286 | Tragic 15.0% |
| Inupiat | 0.0 /100 | #287 | Tragic 15.1% |
| Yaqui | 0.0 /100 | #288 | Tragic 15.1% |
| Immigrants | Belize | 0.0 /100 | #289 | Tragic 15.1% |
| Mexicans | 0.0 /100 | #290 | Tragic 15.1% |
| Immigrants | Cabo Verde | 0.0 /100 | #291 | Tragic 15.1% |
Demographics Similar to Latvians by Poverty
In terms of poverty, the demographic groups most similar to Latvians are Norwegian (10.5%, a difference of 0.10%), Immigrants from Scotland (10.6%, a difference of 0.39%), Lithuanian (10.5%, a difference of 0.46%), Immigrants from North Macedonia (10.6%, a difference of 0.51%), and Luxembourger (10.6%, a difference of 0.58%).
| Demographics | Rating | Rank | Poverty |
| Immigrants | Lithuania | 99.9 /100 | #11 | Exceptional 10.3% |
| Bhutanese | 99.8 /100 | #12 | Exceptional 10.4% |
| Immigrants | Hong Kong | 99.8 /100 | #13 | Exceptional 10.4% |
| Immigrants | Bolivia | 99.8 /100 | #14 | Exceptional 10.4% |
| Bolivians | 99.8 /100 | #15 | Exceptional 10.4% |
| Lithuanians | 99.8 /100 | #16 | Exceptional 10.5% |
| Norwegians | 99.8 /100 | #17 | Exceptional 10.5% |
| Latvians | 99.8 /100 | #18 | Exceptional 10.5% |
| Immigrants | Scotland | 99.7 /100 | #19 | Exceptional 10.6% |
| Immigrants | North Macedonia | 99.7 /100 | #20 | Exceptional 10.6% |
| Luxembourgers | 99.7 /100 | #21 | Exceptional 10.6% |
| Eastern Europeans | 99.7 /100 | #22 | Exceptional 10.6% |
| Swedes | 99.7 /100 | #23 | Exceptional 10.6% |
| Italians | 99.7 /100 | #24 | Exceptional 10.6% |
| Croatians | 99.6 /100 | #25 | Exceptional 10.6% |