Ecuadorian vs Latvian Poverty
COMPARE
Ecuadorian
Latvian
Poverty
Poverty Comparison
Ecuadorians
Latvians
14.0%
POVERTY
0.4/ 100
METRIC RATING
242nd/ 347
METRIC RANK
10.5%
POVERTY
99.8/ 100
METRIC RATING
18th/ 347
METRIC RANK
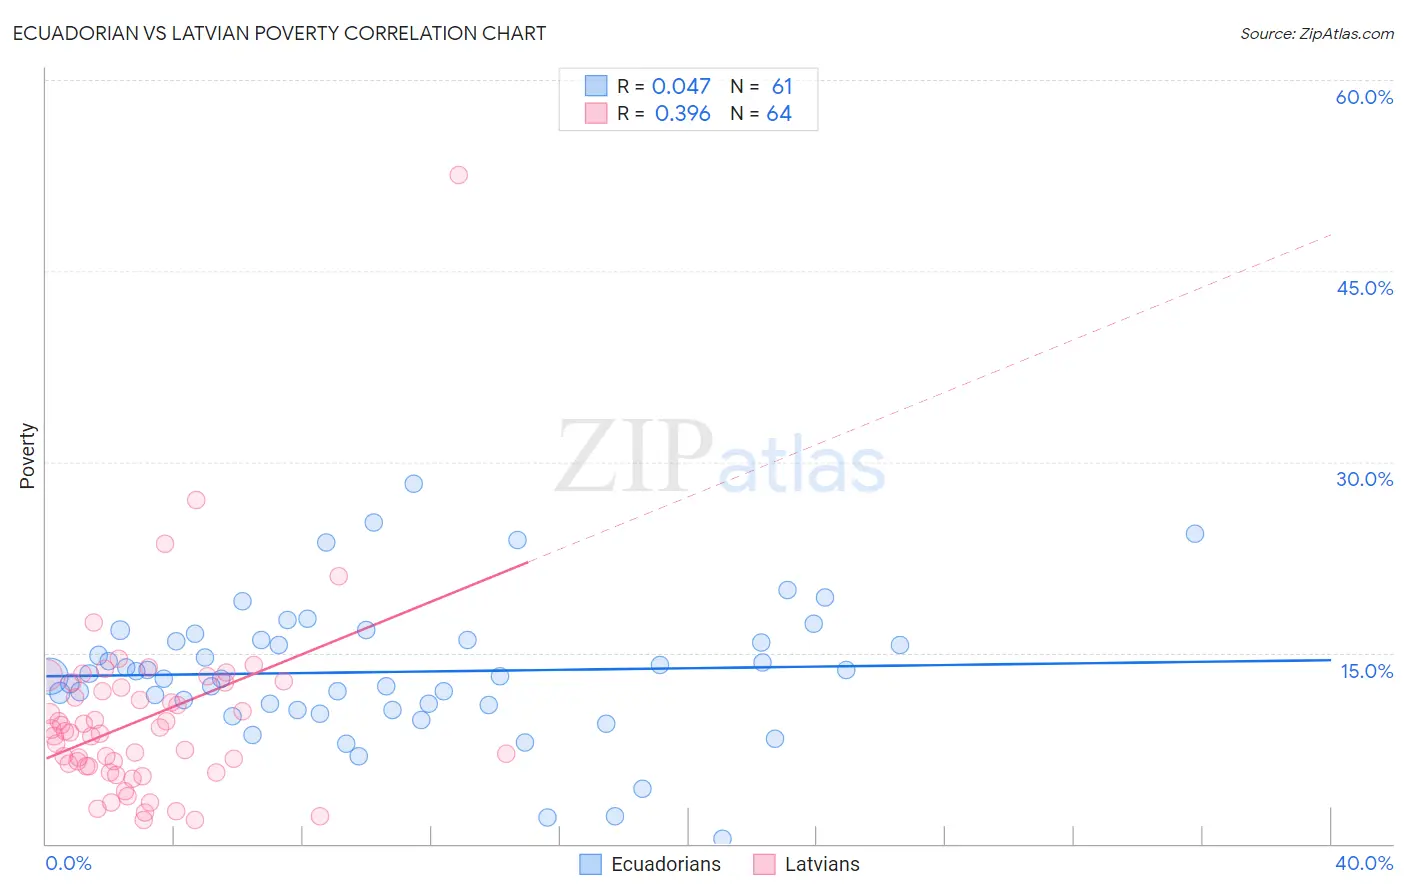
Ecuadorian vs Latvian Poverty Correlation Chart
The statistical analysis conducted on geographies consisting of 317,659,954 people shows no correlation between the proportion of Ecuadorians and poverty level in the United States with a correlation coefficient (R) of 0.047 and weighted average of 14.0%. Similarly, the statistical analysis conducted on geographies consisting of 220,650,145 people shows a mild positive correlation between the proportion of Latvians and poverty level in the United States with a correlation coefficient (R) of 0.396 and weighted average of 10.5%, a difference of 33.1%.
Poverty Correlation Summary
| Measurement | Ecuadorian | Latvian |
| Minimum | 0.41% | 1.8% |
| Maximum | 28.2% | 52.6% |
| Range | 27.8% | 50.7% |
| Mean | 13.5% | 9.9% |
| Median | 13.2% | 8.8% |
| Interquartile 25% (IQ1) | 10.7% | 6.1% |
| Interquartile 75% (IQ3) | 16.0% | 12.5% |
| Interquartile Range (IQR) | 5.3% | 6.4% |
| Standard Deviation (Sample) | 5.3% | 7.3% |
| Standard Deviation (Population) | 5.3% | 7.3% |
Similar Demographics by Poverty
Demographics Similar to Ecuadorians by Poverty
In terms of poverty, the demographic groups most similar to Ecuadorians are Sudanese (14.0%, a difference of 0.070%), Nepalese (14.0%, a difference of 0.10%), Salvadoran (14.0%, a difference of 0.31%), Immigrants from Middle Africa (14.0%, a difference of 0.34%), and Nicaraguan (13.9%, a difference of 0.46%).
| Demographics | Rating | Rank | Poverty |
| Cubans | 0.6 /100 | #235 | Tragic 13.9% |
| Immigrants | Armenia | 0.5 /100 | #236 | Tragic 13.9% |
| French American Indians | 0.5 /100 | #237 | Tragic 13.9% |
| Ghanaians | 0.5 /100 | #238 | Tragic 13.9% |
| Nicaraguans | 0.4 /100 | #239 | Tragic 13.9% |
| Immigrants | Middle Africa | 0.4 /100 | #240 | Tragic 14.0% |
| Salvadorans | 0.4 /100 | #241 | Tragic 14.0% |
| Ecuadorians | 0.4 /100 | #242 | Tragic 14.0% |
| Sudanese | 0.3 /100 | #243 | Tragic 14.0% |
| Nepalese | 0.3 /100 | #244 | Tragic 14.0% |
| Immigrants | Sudan | 0.3 /100 | #245 | Tragic 14.1% |
| Potawatomi | 0.3 /100 | #246 | Tragic 14.1% |
| Liberians | 0.2 /100 | #247 | Tragic 14.1% |
| Immigrants | Western Africa | 0.2 /100 | #248 | Tragic 14.1% |
| Immigrants | Ghana | 0.2 /100 | #249 | Tragic 14.2% |
Demographics Similar to Latvians by Poverty
In terms of poverty, the demographic groups most similar to Latvians are Norwegian (10.5%, a difference of 0.10%), Immigrants from Scotland (10.6%, a difference of 0.39%), Lithuanian (10.5%, a difference of 0.46%), Immigrants from North Macedonia (10.6%, a difference of 0.51%), and Luxembourger (10.6%, a difference of 0.58%).
| Demographics | Rating | Rank | Poverty |
| Immigrants | Lithuania | 99.9 /100 | #11 | Exceptional 10.3% |
| Bhutanese | 99.8 /100 | #12 | Exceptional 10.4% |
| Immigrants | Hong Kong | 99.8 /100 | #13 | Exceptional 10.4% |
| Immigrants | Bolivia | 99.8 /100 | #14 | Exceptional 10.4% |
| Bolivians | 99.8 /100 | #15 | Exceptional 10.4% |
| Lithuanians | 99.8 /100 | #16 | Exceptional 10.5% |
| Norwegians | 99.8 /100 | #17 | Exceptional 10.5% |
| Latvians | 99.8 /100 | #18 | Exceptional 10.5% |
| Immigrants | Scotland | 99.7 /100 | #19 | Exceptional 10.6% |
| Immigrants | North Macedonia | 99.7 /100 | #20 | Exceptional 10.6% |
| Luxembourgers | 99.7 /100 | #21 | Exceptional 10.6% |
| Eastern Europeans | 99.7 /100 | #22 | Exceptional 10.6% |
| Swedes | 99.7 /100 | #23 | Exceptional 10.6% |
| Italians | 99.7 /100 | #24 | Exceptional 10.6% |
| Croatians | 99.6 /100 | #25 | Exceptional 10.6% |