Spaniard vs Sioux Male Poverty
COMPARE
Spaniard
Sioux
Male Poverty
Male Poverty Comparison
Spaniards
Sioux
11.7%
MALE POVERTY
13.5/ 100
METRIC RATING
201st/ 347
METRIC RANK
18.7%
MALE POVERTY
0.0/ 100
METRIC RATING
337th/ 347
METRIC RANK
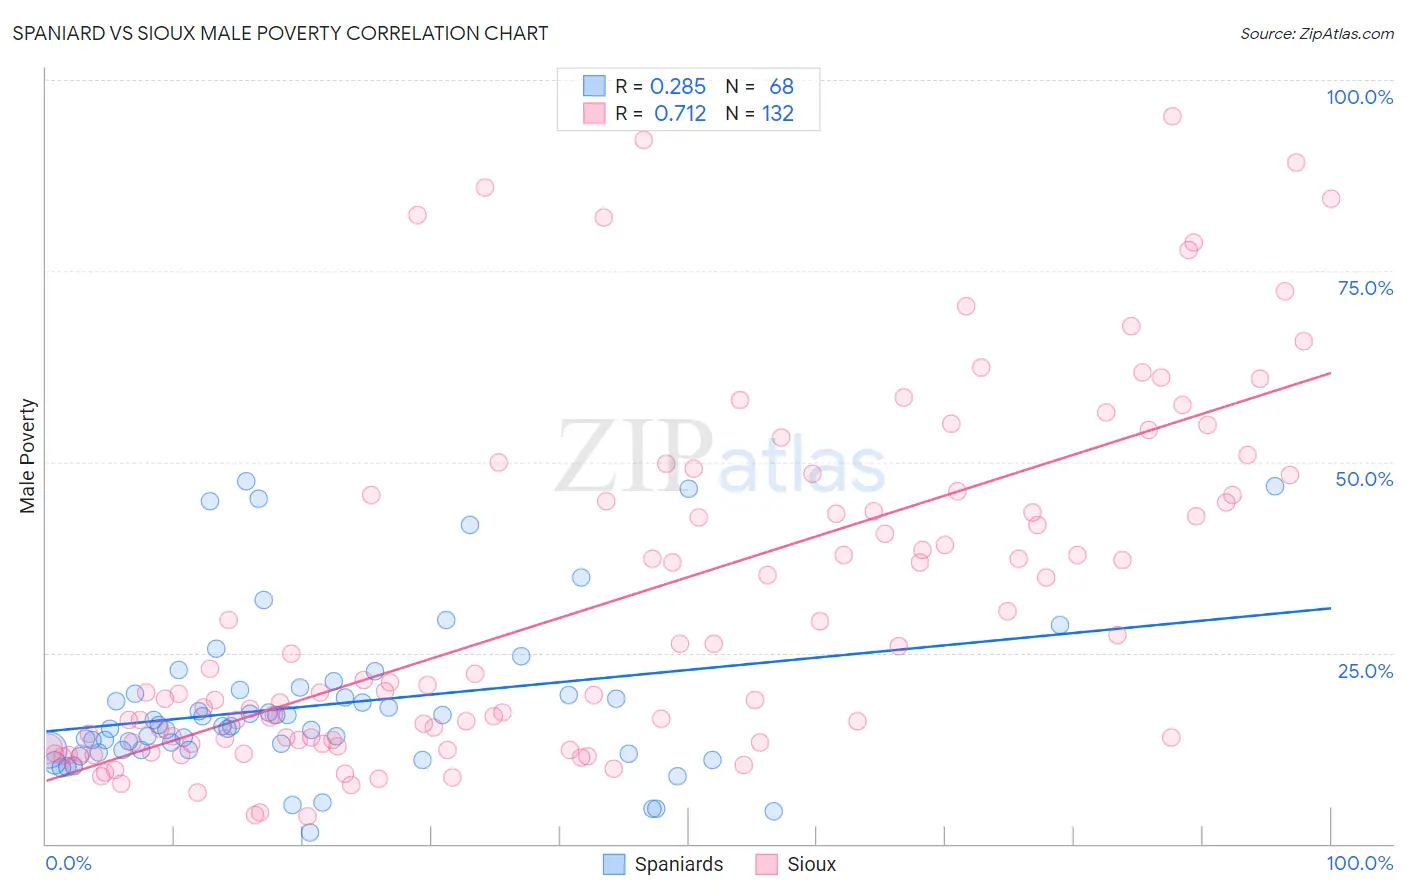
Spaniard vs Sioux Male Poverty Correlation Chart
The statistical analysis conducted on geographies consisting of 442,977,200 people shows a weak positive correlation between the proportion of Spaniards and poverty level among males in the United States with a correlation coefficient (R) of 0.285 and weighted average of 11.7%. Similarly, the statistical analysis conducted on geographies consisting of 234,075,552 people shows a strong positive correlation between the proportion of Sioux and poverty level among males in the United States with a correlation coefficient (R) of 0.712 and weighted average of 18.7%, a difference of 59.9%.
Male Poverty Correlation Summary
| Measurement | Spaniard | Sioux |
| Minimum | 1.5% | 3.5% |
| Maximum | 47.5% | 95.3% |
| Range | 46.0% | 91.7% |
| Mean | 18.1% | 31.5% |
| Median | 15.3% | 20.9% |
| Interquartile 25% (IQ1) | 12.3% | 13.4% |
| Interquartile 75% (IQ3) | 19.9% | 45.7% |
| Interquartile Range (IQR) | 7.6% | 32.2% |
| Standard Deviation (Sample) | 10.6% | 22.7% |
| Standard Deviation (Population) | 10.5% | 22.6% |
Similar Demographics by Male Poverty
Demographics Similar to Spaniards by Male Poverty
In terms of male poverty, the demographic groups most similar to Spaniards are Immigrants from Lebanon (11.7%, a difference of 0.010%), Spanish (11.7%, a difference of 0.11%), Iraqi (11.7%, a difference of 0.22%), Delaware (11.7%, a difference of 0.36%), and Arab (11.6%, a difference of 0.42%).
| Demographics | Rating | Rank | Male Poverty |
| Immigrants | Kenya | 16.1 /100 | #194 | Poor 11.6% |
| Arabs | 15.8 /100 | #195 | Poor 11.6% |
| Hmong | 15.8 /100 | #196 | Poor 11.6% |
| Delaware | 15.4 /100 | #197 | Poor 11.7% |
| Iraqis | 14.7 /100 | #198 | Poor 11.7% |
| Spanish | 14.1 /100 | #199 | Poor 11.7% |
| Immigrants | Lebanon | 13.6 /100 | #200 | Poor 11.7% |
| Spaniards | 13.5 /100 | #201 | Poor 11.7% |
| Aleuts | 10.4 /100 | #202 | Poor 11.8% |
| Immigrants | Western Asia | 9.8 /100 | #203 | Tragic 11.8% |
| Immigrants | Uganda | 8.5 /100 | #204 | Tragic 11.8% |
| Panamanians | 6.2 /100 | #205 | Tragic 11.9% |
| Immigrants | Eastern Africa | 5.4 /100 | #206 | Tragic 12.0% |
| Malaysians | 5.2 /100 | #207 | Tragic 12.0% |
| Immigrants | Immigrants | 4.5 /100 | #208 | Tragic 12.0% |
Demographics Similar to Sioux by Male Poverty
In terms of male poverty, the demographic groups most similar to Sioux are Pueblo (18.5%, a difference of 1.1%), Crow (19.1%, a difference of 2.3%), Yuman (19.5%, a difference of 4.5%), Apache (17.7%, a difference of 5.9%), and Cheyenne (17.6%, a difference of 6.1%).
| Demographics | Rating | Rank | Male Poverty |
| Immigrants | Dominican Republic | 0.0 /100 | #330 | Tragic 16.2% |
| Ute | 0.0 /100 | #331 | Tragic 16.2% |
| Houma | 0.0 /100 | #332 | Tragic 16.7% |
| Natives/Alaskans | 0.0 /100 | #333 | Tragic 16.9% |
| Cheyenne | 0.0 /100 | #334 | Tragic 17.6% |
| Apache | 0.0 /100 | #335 | Tragic 17.7% |
| Pueblo | 0.0 /100 | #336 | Tragic 18.5% |
| Sioux | 0.0 /100 | #337 | Tragic 18.7% |
| Crow | 0.0 /100 | #338 | Tragic 19.1% |
| Yuman | 0.0 /100 | #339 | Tragic 19.5% |
| Immigrants | Yemen | 0.0 /100 | #340 | Tragic 20.1% |
| Lumbee | 0.0 /100 | #341 | Tragic 20.2% |
| Pima | 0.0 /100 | #342 | Tragic 20.4% |
| Yup'ik | 0.0 /100 | #343 | Tragic 20.4% |
| Hopi | 0.0 /100 | #344 | Tragic 20.8% |