Spaniard vs Immigrants from Northern Africa Male Poverty
COMPARE
Spaniard
Immigrants from Northern Africa
Male Poverty
Male Poverty Comparison
Spaniards
Immigrants from Northern Africa
11.7%
MALE POVERTY
13.5/ 100
METRIC RATING
201st/ 347
METRIC RANK
11.1%
MALE POVERTY
59.7/ 100
METRIC RATING
161st/ 347
METRIC RANK
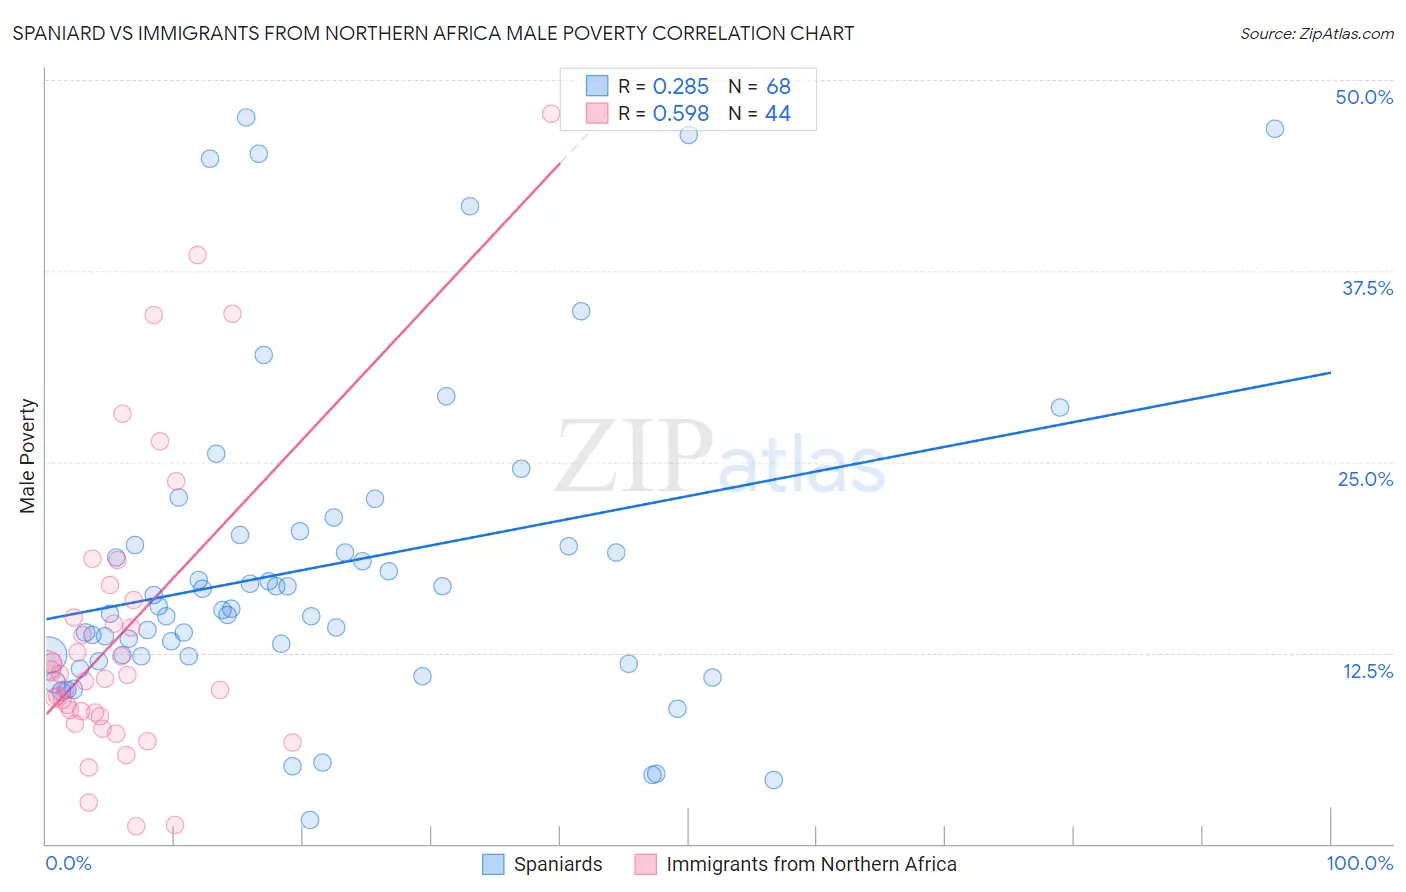
Spaniard vs Immigrants from Northern Africa Male Poverty Correlation Chart
The statistical analysis conducted on geographies consisting of 442,977,200 people shows a weak positive correlation between the proportion of Spaniards and poverty level among males in the United States with a correlation coefficient (R) of 0.285 and weighted average of 11.7%. Similarly, the statistical analysis conducted on geographies consisting of 320,989,271 people shows a substantial positive correlation between the proportion of Immigrants from Northern Africa and poverty level among males in the United States with a correlation coefficient (R) of 0.598 and weighted average of 11.1%, a difference of 5.6%.
Male Poverty Correlation Summary
| Measurement | Spaniard | Immigrants from Northern Africa |
| Minimum | 1.5% | 1.1% |
| Maximum | 47.5% | 47.8% |
| Range | 46.0% | 46.7% |
| Mean | 18.1% | 13.8% |
| Median | 15.3% | 10.9% |
| Interquartile 25% (IQ1) | 12.3% | 8.5% |
| Interquartile 75% (IQ3) | 19.9% | 15.4% |
| Interquartile Range (IQR) | 7.6% | 6.9% |
| Standard Deviation (Sample) | 10.6% | 9.9% |
| Standard Deviation (Population) | 10.5% | 9.8% |
Similar Demographics by Male Poverty
Demographics Similar to Spaniards by Male Poverty
In terms of male poverty, the demographic groups most similar to Spaniards are Immigrants from Lebanon (11.7%, a difference of 0.010%), Spanish (11.7%, a difference of 0.11%), Iraqi (11.7%, a difference of 0.22%), Delaware (11.7%, a difference of 0.36%), and Arab (11.6%, a difference of 0.42%).
| Demographics | Rating | Rank | Male Poverty |
| Immigrants | Kenya | 16.1 /100 | #194 | Poor 11.6% |
| Arabs | 15.8 /100 | #195 | Poor 11.6% |
| Hmong | 15.8 /100 | #196 | Poor 11.6% |
| Delaware | 15.4 /100 | #197 | Poor 11.7% |
| Iraqis | 14.7 /100 | #198 | Poor 11.7% |
| Spanish | 14.1 /100 | #199 | Poor 11.7% |
| Immigrants | Lebanon | 13.6 /100 | #200 | Poor 11.7% |
| Spaniards | 13.5 /100 | #201 | Poor 11.7% |
| Aleuts | 10.4 /100 | #202 | Poor 11.8% |
| Immigrants | Western Asia | 9.8 /100 | #203 | Tragic 11.8% |
| Immigrants | Uganda | 8.5 /100 | #204 | Tragic 11.8% |
| Panamanians | 6.2 /100 | #205 | Tragic 11.9% |
| Immigrants | Eastern Africa | 5.4 /100 | #206 | Tragic 12.0% |
| Malaysians | 5.2 /100 | #207 | Tragic 12.0% |
| Immigrants | Immigrants | 4.5 /100 | #208 | Tragic 12.0% |
Demographics Similar to Immigrants from Northern Africa by Male Poverty
In terms of male poverty, the demographic groups most similar to Immigrants from Northern Africa are Soviet Union (11.1%, a difference of 0.070%), Immigrants from Chile (11.1%, a difference of 0.23%), White/Caucasian (11.1%, a difference of 0.30%), Ethiopian (11.1%, a difference of 0.30%), and Taiwanese (11.0%, a difference of 0.32%).
| Demographics | Rating | Rank | Male Poverty |
| Immigrants | Kazakhstan | 64.8 /100 | #154 | Good 11.0% |
| Immigrants | Malaysia | 64.7 /100 | #155 | Good 11.0% |
| Costa Ricans | 63.9 /100 | #156 | Good 11.0% |
| Scotch-Irish | 63.7 /100 | #157 | Good 11.0% |
| Colombians | 63.0 /100 | #158 | Good 11.0% |
| Taiwanese | 62.7 /100 | #159 | Good 11.0% |
| Soviet Union | 60.3 /100 | #160 | Good 11.1% |
| Immigrants | Northern Africa | 59.7 /100 | #161 | Average 11.1% |
| Immigrants | Chile | 57.4 /100 | #162 | Average 11.1% |
| Whites/Caucasians | 56.7 /100 | #163 | Average 11.1% |
| Ethiopians | 56.7 /100 | #164 | Average 11.1% |
| Immigrants | Spain | 55.5 /100 | #165 | Average 11.1% |
| Immigrants | Albania | 55.3 /100 | #166 | Average 11.1% |
| Hungarians | 55.1 /100 | #167 | Average 11.1% |
| Immigrants | Portugal | 54.9 /100 | #168 | Average 11.1% |