Immigrants from Haiti vs Sioux Male Poverty
COMPARE
Immigrants from Haiti
Sioux
Male Poverty
Male Poverty Comparison
Immigrants from Haiti
Sioux
13.8%
MALE POVERTY
0.0/ 100
METRIC RATING
284th/ 347
METRIC RANK
18.7%
MALE POVERTY
0.0/ 100
METRIC RATING
337th/ 347
METRIC RANK
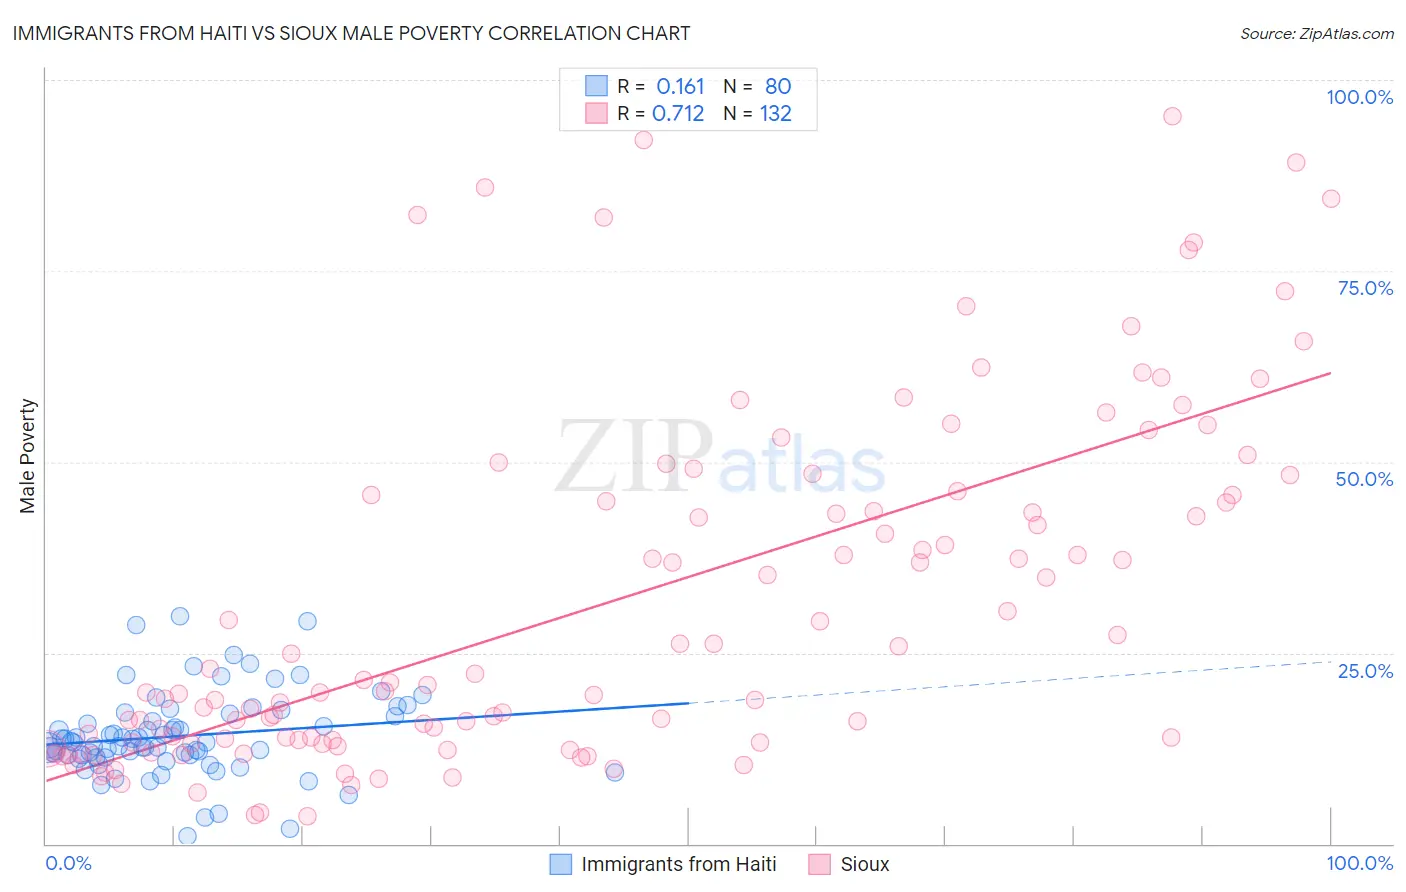
Immigrants from Haiti vs Sioux Male Poverty Correlation Chart
The statistical analysis conducted on geographies consisting of 225,134,025 people shows a poor positive correlation between the proportion of Immigrants from Haiti and poverty level among males in the United States with a correlation coefficient (R) of 0.161 and weighted average of 13.8%. Similarly, the statistical analysis conducted on geographies consisting of 234,075,552 people shows a strong positive correlation between the proportion of Sioux and poverty level among males in the United States with a correlation coefficient (R) of 0.712 and weighted average of 18.7%, a difference of 36.0%.
Male Poverty Correlation Summary
| Measurement | Immigrants from Haiti | Sioux |
| Minimum | 0.99% | 3.5% |
| Maximum | 29.8% | 95.3% |
| Range | 28.8% | 91.7% |
| Mean | 14.1% | 31.5% |
| Median | 13.3% | 20.9% |
| Interquartile 25% (IQ1) | 11.5% | 13.4% |
| Interquartile 75% (IQ3) | 16.9% | 45.7% |
| Interquartile Range (IQR) | 5.4% | 32.2% |
| Standard Deviation (Sample) | 5.5% | 22.7% |
| Standard Deviation (Population) | 5.5% | 22.6% |
Similar Demographics by Male Poverty
Demographics Similar to Immigrants from Haiti by Male Poverty
In terms of male poverty, the demographic groups most similar to Immigrants from Haiti are Comanche (13.8%, a difference of 0.010%), West Indian (13.8%, a difference of 0.010%), Shoshone (13.8%, a difference of 0.040%), Immigrants from Barbados (13.8%, a difference of 0.060%), and Immigrants from Cabo Verde (13.7%, a difference of 0.21%).
| Demographics | Rating | Rank | Male Poverty |
| Bangladeshis | 0.0 /100 | #277 | Tragic 13.6% |
| Belizeans | 0.0 /100 | #278 | Tragic 13.6% |
| Haitians | 0.0 /100 | #279 | Tragic 13.7% |
| Mexicans | 0.0 /100 | #280 | Tragic 13.7% |
| Yaqui | 0.0 /100 | #281 | Tragic 13.7% |
| Immigrants | Cabo Verde | 0.0 /100 | #282 | Tragic 13.7% |
| Comanche | 0.0 /100 | #283 | Tragic 13.8% |
| Immigrants | Haiti | 0.0 /100 | #284 | Tragic 13.8% |
| West Indians | 0.0 /100 | #285 | Tragic 13.8% |
| Shoshone | 0.0 /100 | #286 | Tragic 13.8% |
| Immigrants | Barbados | 0.0 /100 | #287 | Tragic 13.8% |
| Immigrants | St. Vincent and the Grenadines | 0.0 /100 | #288 | Tragic 13.8% |
| Guatemalans | 0.0 /100 | #289 | Tragic 13.8% |
| Immigrants | Zaire | 0.0 /100 | #290 | Tragic 13.8% |
| Vietnamese | 0.0 /100 | #291 | Tragic 13.8% |
Demographics Similar to Sioux by Male Poverty
In terms of male poverty, the demographic groups most similar to Sioux are Pueblo (18.5%, a difference of 1.1%), Crow (19.1%, a difference of 2.3%), Yuman (19.5%, a difference of 4.5%), Apache (17.7%, a difference of 5.9%), and Cheyenne (17.6%, a difference of 6.1%).
| Demographics | Rating | Rank | Male Poverty |
| Immigrants | Dominican Republic | 0.0 /100 | #330 | Tragic 16.2% |
| Ute | 0.0 /100 | #331 | Tragic 16.2% |
| Houma | 0.0 /100 | #332 | Tragic 16.7% |
| Natives/Alaskans | 0.0 /100 | #333 | Tragic 16.9% |
| Cheyenne | 0.0 /100 | #334 | Tragic 17.6% |
| Apache | 0.0 /100 | #335 | Tragic 17.7% |
| Pueblo | 0.0 /100 | #336 | Tragic 18.5% |
| Sioux | 0.0 /100 | #337 | Tragic 18.7% |
| Crow | 0.0 /100 | #338 | Tragic 19.1% |
| Yuman | 0.0 /100 | #339 | Tragic 19.5% |
| Immigrants | Yemen | 0.0 /100 | #340 | Tragic 20.1% |
| Lumbee | 0.0 /100 | #341 | Tragic 20.2% |
| Pima | 0.0 /100 | #342 | Tragic 20.4% |
| Yup'ik | 0.0 /100 | #343 | Tragic 20.4% |
| Hopi | 0.0 /100 | #344 | Tragic 20.8% |