Spaniard vs Immigrants from Saudi Arabia Male Poverty
COMPARE
Spaniard
Immigrants from Saudi Arabia
Male Poverty
Male Poverty Comparison
Spaniards
Immigrants from Saudi Arabia
11.7%
MALE POVERTY
13.5/ 100
METRIC RATING
201st/ 347
METRIC RANK
12.7%
MALE POVERTY
0.4/ 100
METRIC RATING
236th/ 347
METRIC RANK
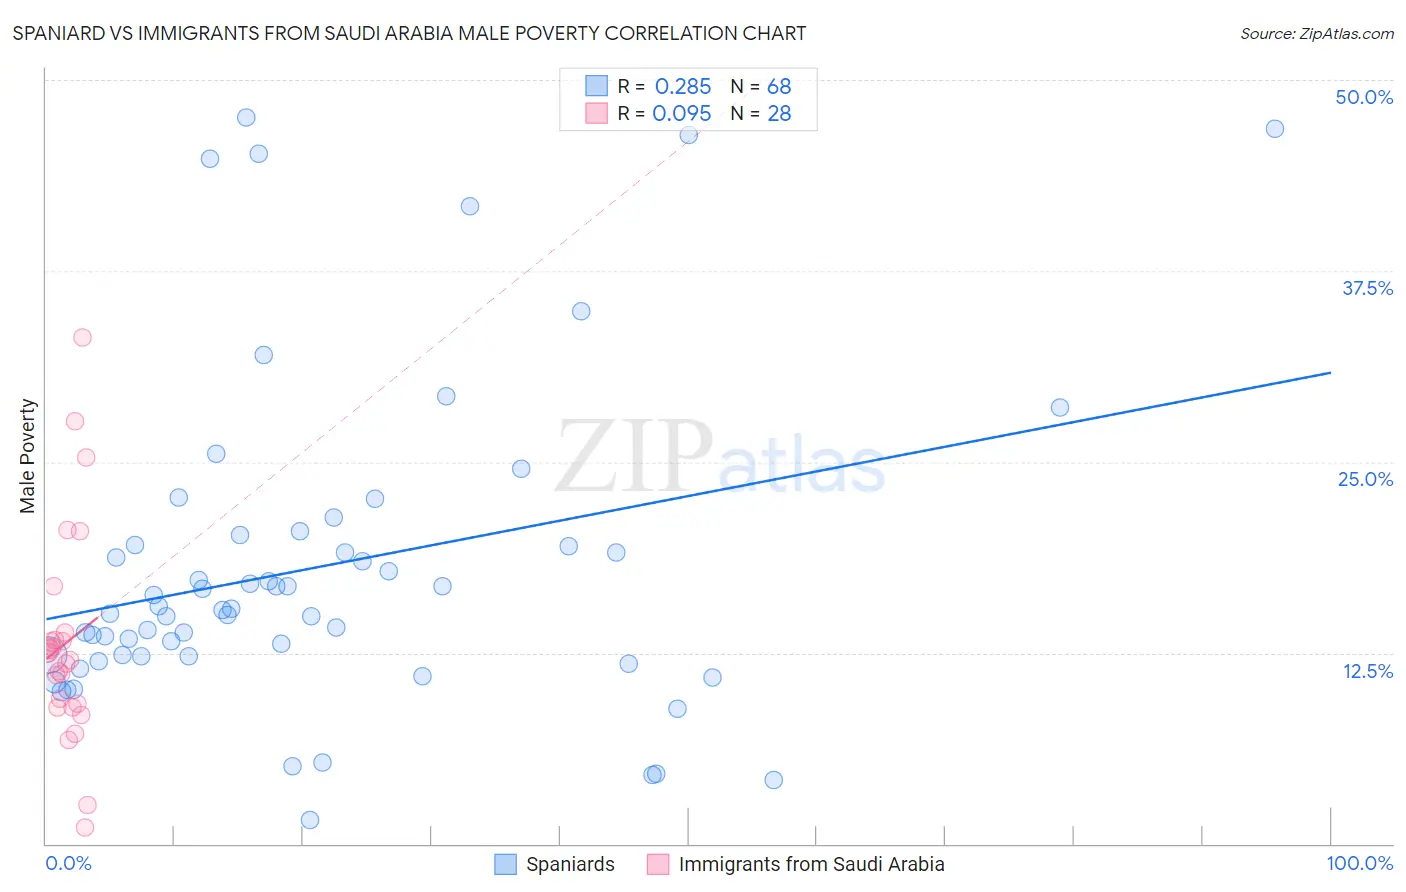
Spaniard vs Immigrants from Saudi Arabia Male Poverty Correlation Chart
The statistical analysis conducted on geographies consisting of 442,977,200 people shows a weak positive correlation between the proportion of Spaniards and poverty level among males in the United States with a correlation coefficient (R) of 0.285 and weighted average of 11.7%. Similarly, the statistical analysis conducted on geographies consisting of 164,207,457 people shows a slight positive correlation between the proportion of Immigrants from Saudi Arabia and poverty level among males in the United States with a correlation coefficient (R) of 0.095 and weighted average of 12.7%, a difference of 8.4%.
Male Poverty Correlation Summary
| Measurement | Spaniard | Immigrants from Saudi Arabia |
| Minimum | 1.5% | 1.1% |
| Maximum | 47.5% | 33.1% |
| Range | 46.0% | 32.0% |
| Mean | 18.1% | 13.2% |
| Median | 15.3% | 12.3% |
| Interquartile 25% (IQ1) | 12.3% | 9.1% |
| Interquartile 75% (IQ3) | 19.9% | 13.6% |
| Interquartile Range (IQR) | 7.6% | 4.5% |
| Standard Deviation (Sample) | 10.6% | 7.0% |
| Standard Deviation (Population) | 10.5% | 6.9% |
Similar Demographics by Male Poverty
Demographics Similar to Spaniards by Male Poverty
In terms of male poverty, the demographic groups most similar to Spaniards are Immigrants from Lebanon (11.7%, a difference of 0.010%), Spanish (11.7%, a difference of 0.11%), Iraqi (11.7%, a difference of 0.22%), Delaware (11.7%, a difference of 0.36%), and Arab (11.6%, a difference of 0.42%).
| Demographics | Rating | Rank | Male Poverty |
| Immigrants | Kenya | 16.1 /100 | #194 | Poor 11.6% |
| Arabs | 15.8 /100 | #195 | Poor 11.6% |
| Hmong | 15.8 /100 | #196 | Poor 11.6% |
| Delaware | 15.4 /100 | #197 | Poor 11.7% |
| Iraqis | 14.7 /100 | #198 | Poor 11.7% |
| Spanish | 14.1 /100 | #199 | Poor 11.7% |
| Immigrants | Lebanon | 13.6 /100 | #200 | Poor 11.7% |
| Spaniards | 13.5 /100 | #201 | Poor 11.7% |
| Aleuts | 10.4 /100 | #202 | Poor 11.8% |
| Immigrants | Western Asia | 9.8 /100 | #203 | Tragic 11.8% |
| Immigrants | Uganda | 8.5 /100 | #204 | Tragic 11.8% |
| Panamanians | 6.2 /100 | #205 | Tragic 11.9% |
| Immigrants | Eastern Africa | 5.4 /100 | #206 | Tragic 12.0% |
| Malaysians | 5.2 /100 | #207 | Tragic 12.0% |
| Immigrants | Immigrants | 4.5 /100 | #208 | Tragic 12.0% |
Demographics Similar to Immigrants from Saudi Arabia by Male Poverty
In terms of male poverty, the demographic groups most similar to Immigrants from Saudi Arabia are French American Indian (12.7%, a difference of 0.050%), Ecuadorian (12.7%, a difference of 0.080%), Ghanaian (12.7%, a difference of 0.080%), Immigrants from Laos (12.6%, a difference of 0.25%), and Immigrants from Middle Africa (12.7%, a difference of 0.35%).
| Demographics | Rating | Rank | Male Poverty |
| Cubans | 1.3 /100 | #229 | Tragic 12.4% |
| Marshallese | 0.8 /100 | #230 | Tragic 12.5% |
| Salvadorans | 0.6 /100 | #231 | Tragic 12.6% |
| Nicaraguans | 0.6 /100 | #232 | Tragic 12.6% |
| Fijians | 0.6 /100 | #233 | Tragic 12.6% |
| Immigrants | Armenia | 0.6 /100 | #234 | Tragic 12.6% |
| Immigrants | Laos | 0.5 /100 | #235 | Tragic 12.6% |
| Immigrants | Saudi Arabia | 0.4 /100 | #236 | Tragic 12.7% |
| French American Indians | 0.4 /100 | #237 | Tragic 12.7% |
| Ecuadorians | 0.4 /100 | #238 | Tragic 12.7% |
| Ghanaians | 0.4 /100 | #239 | Tragic 12.7% |
| Immigrants | Middle Africa | 0.4 /100 | #240 | Tragic 12.7% |
| Sudanese | 0.3 /100 | #241 | Tragic 12.8% |
| Nepalese | 0.3 /100 | #242 | Tragic 12.8% |
| Alaskan Athabascans | 0.3 /100 | #243 | Tragic 12.8% |