Spaniard vs Immigrants from Scotland Male Poverty
COMPARE
Spaniard
Immigrants from Scotland
Male Poverty
Male Poverty Comparison
Spaniards
Immigrants from Scotland
11.7%
MALE POVERTY
13.5/ 100
METRIC RATING
201st/ 347
METRIC RANK
9.6%
MALE POVERTY
99.7/ 100
METRIC RATING
21st/ 347
METRIC RANK
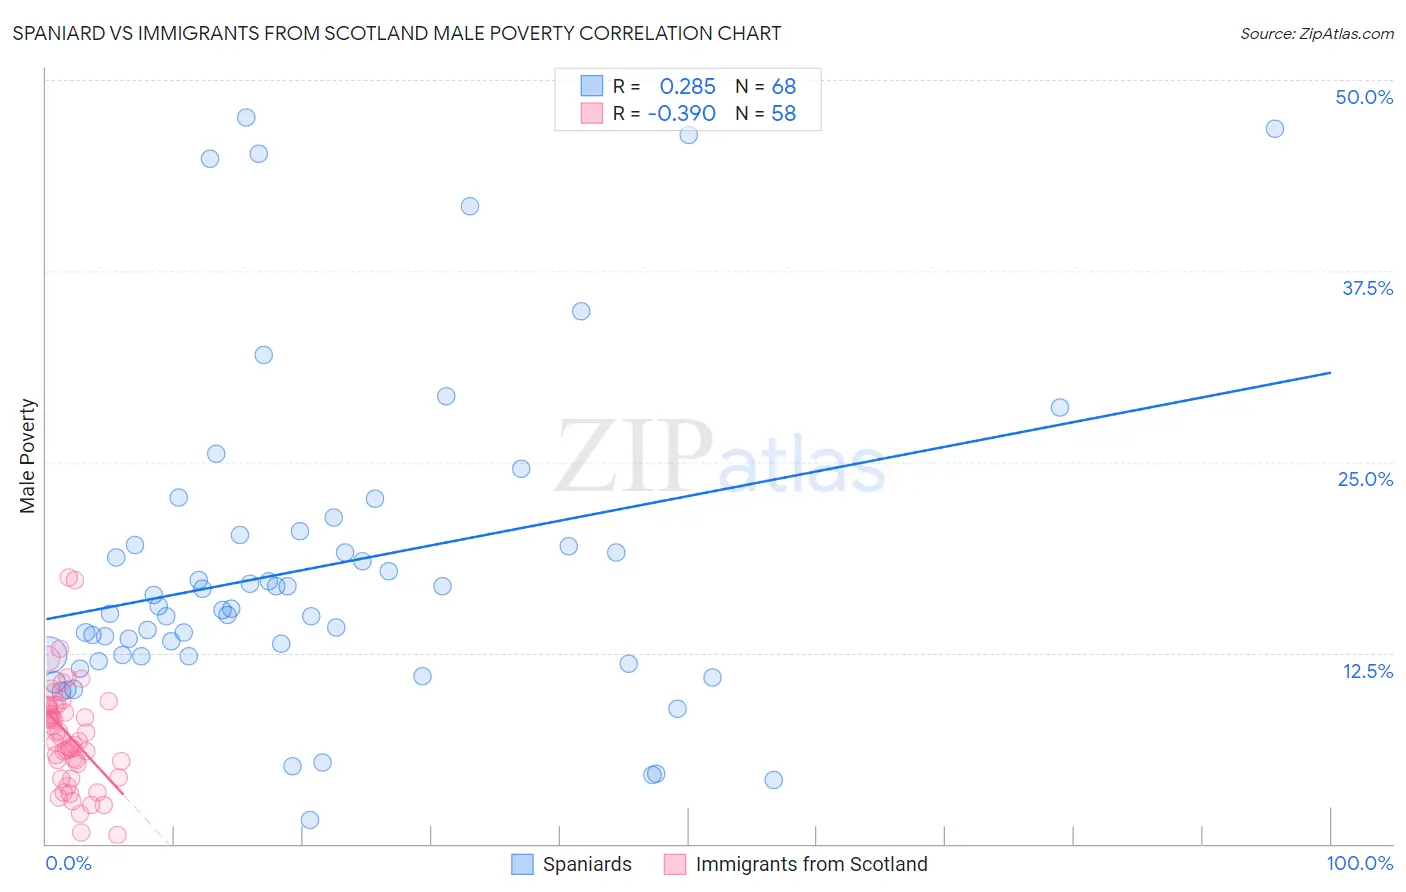
Spaniard vs Immigrants from Scotland Male Poverty Correlation Chart
The statistical analysis conducted on geographies consisting of 442,977,200 people shows a weak positive correlation between the proportion of Spaniards and poverty level among males in the United States with a correlation coefficient (R) of 0.285 and weighted average of 11.7%. Similarly, the statistical analysis conducted on geographies consisting of 196,352,980 people shows a mild negative correlation between the proportion of Immigrants from Scotland and poverty level among males in the United States with a correlation coefficient (R) of -0.390 and weighted average of 9.6%, a difference of 21.9%.
Male Poverty Correlation Summary
| Measurement | Spaniard | Immigrants from Scotland |
| Minimum | 1.5% | 0.60% |
| Maximum | 47.5% | 17.4% |
| Range | 46.0% | 16.8% |
| Mean | 18.1% | 7.1% |
| Median | 15.3% | 6.8% |
| Interquartile 25% (IQ1) | 12.3% | 5.3% |
| Interquartile 75% (IQ3) | 19.9% | 9.0% |
| Interquartile Range (IQR) | 7.6% | 3.7% |
| Standard Deviation (Sample) | 10.6% | 3.4% |
| Standard Deviation (Population) | 10.5% | 3.3% |
Similar Demographics by Male Poverty
Demographics Similar to Spaniards by Male Poverty
In terms of male poverty, the demographic groups most similar to Spaniards are Immigrants from Lebanon (11.7%, a difference of 0.010%), Spanish (11.7%, a difference of 0.11%), Iraqi (11.7%, a difference of 0.22%), Delaware (11.7%, a difference of 0.36%), and Arab (11.6%, a difference of 0.42%).
| Demographics | Rating | Rank | Male Poverty |
| Immigrants | Kenya | 16.1 /100 | #194 | Poor 11.6% |
| Arabs | 15.8 /100 | #195 | Poor 11.6% |
| Hmong | 15.8 /100 | #196 | Poor 11.6% |
| Delaware | 15.4 /100 | #197 | Poor 11.7% |
| Iraqis | 14.7 /100 | #198 | Poor 11.7% |
| Spanish | 14.1 /100 | #199 | Poor 11.7% |
| Immigrants | Lebanon | 13.6 /100 | #200 | Poor 11.7% |
| Spaniards | 13.5 /100 | #201 | Poor 11.7% |
| Aleuts | 10.4 /100 | #202 | Poor 11.8% |
| Immigrants | Western Asia | 9.8 /100 | #203 | Tragic 11.8% |
| Immigrants | Uganda | 8.5 /100 | #204 | Tragic 11.8% |
| Panamanians | 6.2 /100 | #205 | Tragic 11.9% |
| Immigrants | Eastern Africa | 5.4 /100 | #206 | Tragic 12.0% |
| Malaysians | 5.2 /100 | #207 | Tragic 12.0% |
| Immigrants | Immigrants | 4.5 /100 | #208 | Tragic 12.0% |
Demographics Similar to Immigrants from Scotland by Male Poverty
In terms of male poverty, the demographic groups most similar to Immigrants from Scotland are Croatian (9.6%, a difference of 0.25%), Latvian (9.6%, a difference of 0.26%), Italian (9.6%, a difference of 0.26%), Swedish (9.6%, a difference of 0.34%), and Immigrants from Hong Kong (9.6%, a difference of 0.36%).
| Demographics | Rating | Rank | Male Poverty |
| Immigrants | North Macedonia | 99.8 /100 | #14 | Exceptional 9.4% |
| Bhutanese | 99.8 /100 | #15 | Exceptional 9.5% |
| Luxembourgers | 99.8 /100 | #16 | Exceptional 9.5% |
| Norwegians | 99.8 /100 | #17 | Exceptional 9.5% |
| Lithuanians | 99.8 /100 | #18 | Exceptional 9.5% |
| Immigrants | Hong Kong | 99.7 /100 | #19 | Exceptional 9.6% |
| Latvians | 99.7 /100 | #20 | Exceptional 9.6% |
| Immigrants | Scotland | 99.7 /100 | #21 | Exceptional 9.6% |
| Croatians | 99.7 /100 | #22 | Exceptional 9.6% |
| Italians | 99.7 /100 | #23 | Exceptional 9.6% |
| Swedes | 99.7 /100 | #24 | Exceptional 9.6% |
| Eastern Europeans | 99.6 /100 | #25 | Exceptional 9.6% |
| Burmese | 99.6 /100 | #26 | Exceptional 9.7% |
| Danes | 99.6 /100 | #27 | Exceptional 9.7% |
| Immigrants | Korea | 99.6 /100 | #28 | Exceptional 9.7% |