Spaniard vs Immigrants from Eritrea Married-Couple Family Poverty
COMPARE
Spaniard
Immigrants from Eritrea
Married-Couple Family Poverty
Married-Couple Family Poverty Comparison
Spaniards
Immigrants from Eritrea
5.4%
MARRIED-COUPLE FAMILY POVERTY
27.4/ 100
METRIC RATING
196th/ 347
METRIC RANK
5.9%
MARRIED-COUPLE FAMILY POVERTY
1.1/ 100
METRIC RATING
250th/ 347
METRIC RANK
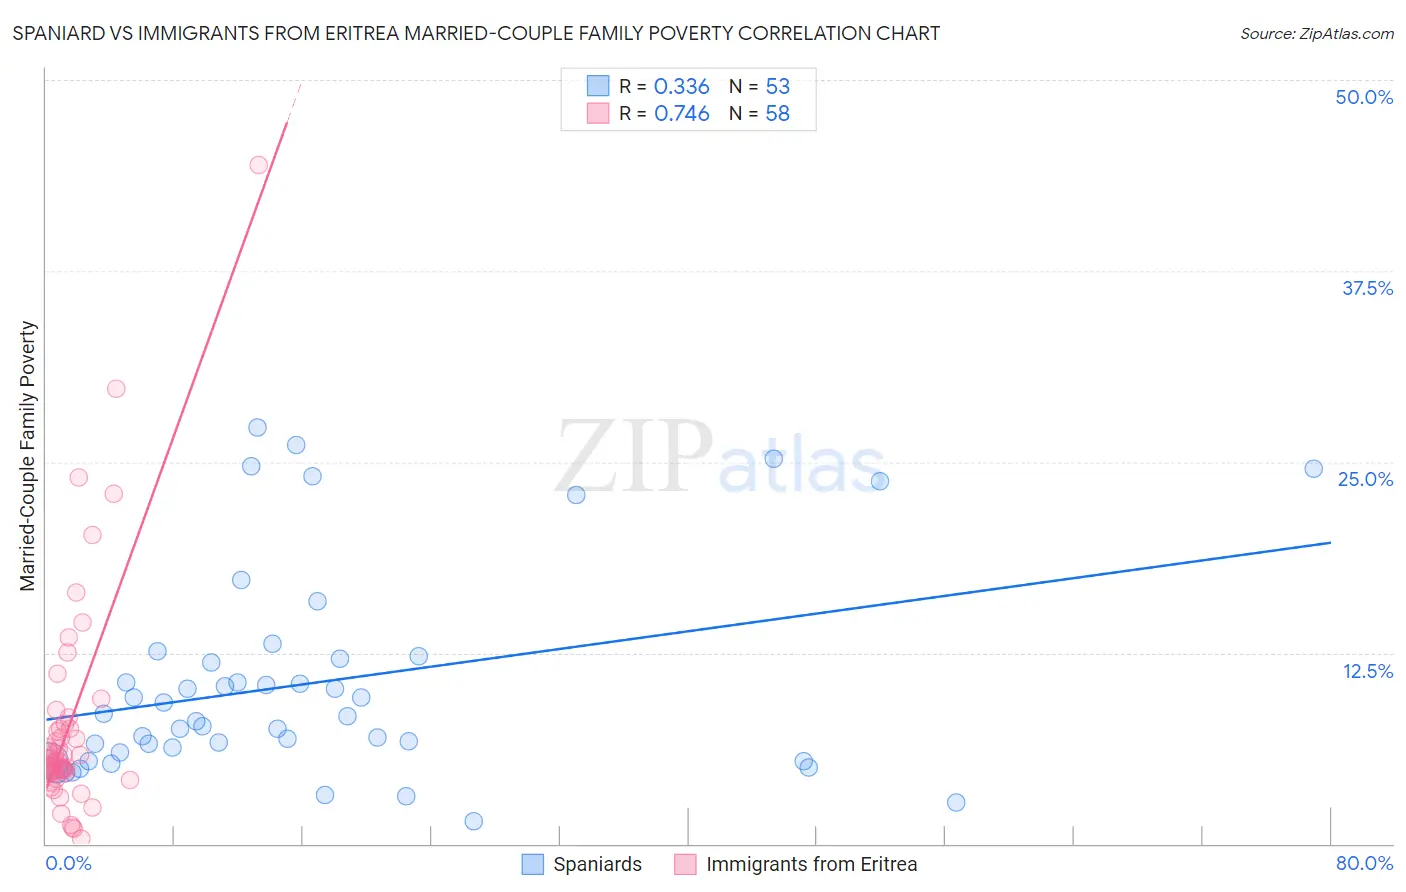
Spaniard vs Immigrants from Eritrea Married-Couple Family Poverty Correlation Chart
The statistical analysis conducted on geographies consisting of 439,020,295 people shows a mild positive correlation between the proportion of Spaniards and poverty level among married-couple families in the United States with a correlation coefficient (R) of 0.336 and weighted average of 5.4%. Similarly, the statistical analysis conducted on geographies consisting of 104,722,236 people shows a strong positive correlation between the proportion of Immigrants from Eritrea and poverty level among married-couple families in the United States with a correlation coefficient (R) of 0.746 and weighted average of 5.9%, a difference of 10.1%.
Married-Couple Family Poverty Correlation Summary
| Measurement | Spaniard | Immigrants from Eritrea |
| Minimum | 1.5% | 0.29% |
| Maximum | 27.3% | 44.4% |
| Range | 25.8% | 44.2% |
| Mean | 10.5% | 7.8% |
| Median | 8.3% | 5.4% |
| Interquartile 25% (IQ1) | 5.7% | 4.7% |
| Interquartile 75% (IQ3) | 12.2% | 7.5% |
| Interquartile Range (IQR) | 6.5% | 2.8% |
| Standard Deviation (Sample) | 6.9% | 7.5% |
| Standard Deviation (Population) | 6.8% | 7.4% |
Similar Demographics by Married-Couple Family Poverty
Demographics Similar to Spaniards by Married-Couple Family Poverty
In terms of married-couple family poverty, the demographic groups most similar to Spaniards are Immigrants from the Azores (5.4%, a difference of 0.020%), Immigrants from Israel (5.4%, a difference of 0.060%), Liberian (5.4%, a difference of 0.15%), Immigrants from Belarus (5.4%, a difference of 0.18%), and Malaysian (5.4%, a difference of 0.29%).
| Demographics | Rating | Rank | Married-Couple Family Poverty |
| South American Indians | 32.5 /100 | #189 | Fair 5.3% |
| Ugandans | 31.6 /100 | #190 | Fair 5.3% |
| Immigrants | Cabo Verde | 30.9 /100 | #191 | Fair 5.3% |
| Cape Verdeans | 30.7 /100 | #192 | Fair 5.3% |
| Malaysians | 29.5 /100 | #193 | Fair 5.4% |
| Immigrants | Israel | 27.8 /100 | #194 | Fair 5.4% |
| Immigrants | Azores | 27.5 /100 | #195 | Fair 5.4% |
| Spaniards | 27.4 /100 | #196 | Fair 5.4% |
| Liberians | 26.3 /100 | #197 | Fair 5.4% |
| Immigrants | Belarus | 26.2 /100 | #198 | Fair 5.4% |
| Uruguayans | 25.0 /100 | #199 | Fair 5.4% |
| Immigrants | Morocco | 24.3 /100 | #200 | Fair 5.4% |
| Lebanese | 24.1 /100 | #201 | Fair 5.4% |
| Immigrants | Middle Africa | 23.8 /100 | #202 | Fair 5.4% |
| Immigrants | Peru | 21.8 /100 | #203 | Fair 5.4% |
Demographics Similar to Immigrants from Eritrea by Married-Couple Family Poverty
In terms of married-couple family poverty, the demographic groups most similar to Immigrants from Eritrea are Tsimshian (5.9%, a difference of 0.21%), Immigrants from Ghana (5.9%, a difference of 0.25%), Cree (5.9%, a difference of 0.31%), Iraqi (5.9%, a difference of 0.74%), and Immigrants from Western Asia (6.0%, a difference of 0.89%).
| Demographics | Rating | Rank | Married-Couple Family Poverty |
| Somalis | 2.3 /100 | #243 | Tragic 5.8% |
| Chickasaw | 2.3 /100 | #244 | Tragic 5.8% |
| Immigrants | Afghanistan | 2.1 /100 | #245 | Tragic 5.8% |
| Immigrants | Venezuela | 1.8 /100 | #246 | Tragic 5.8% |
| Iraqis | 1.4 /100 | #247 | Tragic 5.9% |
| Cree | 1.2 /100 | #248 | Tragic 5.9% |
| Tsimshian | 1.1 /100 | #249 | Tragic 5.9% |
| Immigrants | Eritrea | 1.1 /100 | #250 | Tragic 5.9% |
| Immigrants | Ghana | 1.0 /100 | #251 | Tragic 5.9% |
| Immigrants | Western Asia | 0.7 /100 | #252 | Tragic 6.0% |
| Africans | 0.7 /100 | #253 | Tragic 6.0% |
| Immigrants | Somalia | 0.7 /100 | #254 | Tragic 6.0% |
| Comanche | 0.7 /100 | #255 | Tragic 6.0% |
| Bangladeshis | 0.5 /100 | #256 | Tragic 6.0% |
| Immigrants | Burma/Myanmar | 0.5 /100 | #257 | Tragic 6.0% |