South American vs Uruguayan Male Poverty
COMPARE
South American
Uruguayan
Male Poverty
Male Poverty Comparison
South Americans
Uruguayans
11.1%
MALE POVERTY
53.8/ 100
METRIC RATING
170th/ 347
METRIC RANK
11.2%
MALE POVERTY
51.0/ 100
METRIC RATING
171st/ 347
METRIC RANK
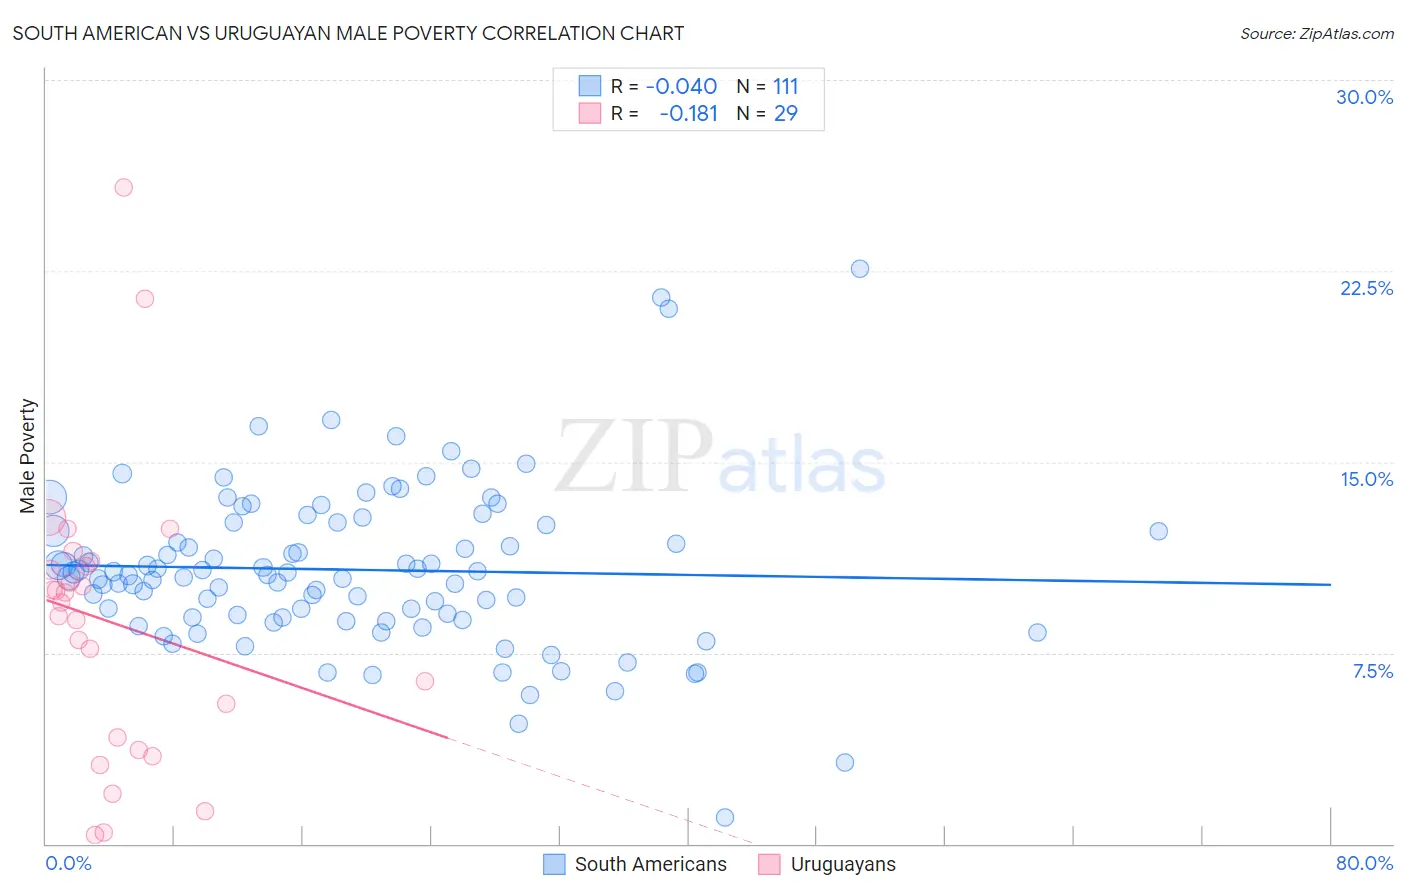
South American vs Uruguayan Male Poverty Correlation Chart
The statistical analysis conducted on geographies consisting of 493,234,153 people shows no correlation between the proportion of South Americans and poverty level among males in the United States with a correlation coefficient (R) of -0.040 and weighted average of 11.1%. Similarly, the statistical analysis conducted on geographies consisting of 144,748,239 people shows a poor negative correlation between the proportion of Uruguayans and poverty level among males in the United States with a correlation coefficient (R) of -0.181 and weighted average of 11.2%, a difference of 0.27%.
Male Poverty Correlation Summary
| Measurement | South American | Uruguayan |
| Minimum | 1.0% | 0.34% |
| Maximum | 22.6% | 25.8% |
| Range | 21.6% | 25.4% |
| Mean | 10.8% | 8.7% |
| Median | 10.6% | 9.5% |
| Interquartile 25% (IQ1) | 8.9% | 3.9% |
| Interquartile 75% (IQ3) | 12.5% | 11.0% |
| Interquartile Range (IQR) | 3.6% | 7.0% |
| Standard Deviation (Sample) | 3.2% | 5.6% |
| Standard Deviation (Population) | 3.2% | 5.5% |
Demographics Similar to South Americans and Uruguayans by Male Poverty
In terms of male poverty, the demographic groups most similar to South Americans are Immigrants from Colombia (11.1%, a difference of 0.040%), Immigrants from Portugal (11.1%, a difference of 0.11%), Hungarian (11.1%, a difference of 0.14%), Immigrants from Albania (11.1%, a difference of 0.15%), and Immigrants from Spain (11.1%, a difference of 0.18%). Similarly, the demographic groups most similar to Uruguayans are Immigrants from Ethiopia (11.2%, a difference of 0.040%), Pennsylvania German (11.2%, a difference of 0.060%), Immigrants from Oceania (11.2%, a difference of 0.10%), Immigrants from Colombia (11.1%, a difference of 0.31%), and Celtic (11.2%, a difference of 0.35%).
| Demographics | Rating | Rank | Male Poverty |
| Soviet Union | 60.3 /100 | #160 | Good 11.1% |
| Immigrants | Northern Africa | 59.7 /100 | #161 | Average 11.1% |
| Immigrants | Chile | 57.4 /100 | #162 | Average 11.1% |
| Whites/Caucasians | 56.7 /100 | #163 | Average 11.1% |
| Ethiopians | 56.7 /100 | #164 | Average 11.1% |
| Immigrants | Spain | 55.5 /100 | #165 | Average 11.1% |
| Immigrants | Albania | 55.3 /100 | #166 | Average 11.1% |
| Hungarians | 55.1 /100 | #167 | Average 11.1% |
| Immigrants | Portugal | 54.9 /100 | #168 | Average 11.1% |
| Immigrants | Colombia | 54.2 /100 | #169 | Average 11.1% |
| South Americans | 53.8 /100 | #170 | Average 11.1% |
| Uruguayans | 51.0 /100 | #171 | Average 11.2% |
| Immigrants | Ethiopia | 50.7 /100 | #172 | Average 11.2% |
| Pennsylvania Germans | 50.5 /100 | #173 | Average 11.2% |
| Immigrants | Oceania | 50.0 /100 | #174 | Average 11.2% |
| Celtics | 47.5 /100 | #175 | Average 11.2% |
| Immigrants | Fiji | 46.0 /100 | #176 | Average 11.2% |
| Lebanese | 45.6 /100 | #177 | Average 11.2% |
| Immigrants | Cameroon | 44.5 /100 | #178 | Average 11.2% |
| Immigrants | Syria | 40.3 /100 | #179 | Average 11.3% |
| Immigrants | Morocco | 40.1 /100 | #180 | Average 11.3% |