Immigrants from Malaysia vs Uruguayan Male Poverty
COMPARE
Immigrants from Malaysia
Uruguayan
Male Poverty
Male Poverty Comparison
Immigrants from Malaysia
Uruguayans
11.0%
MALE POVERTY
64.7/ 100
METRIC RATING
155th/ 347
METRIC RANK
11.2%
MALE POVERTY
51.0/ 100
METRIC RATING
171st/ 347
METRIC RANK
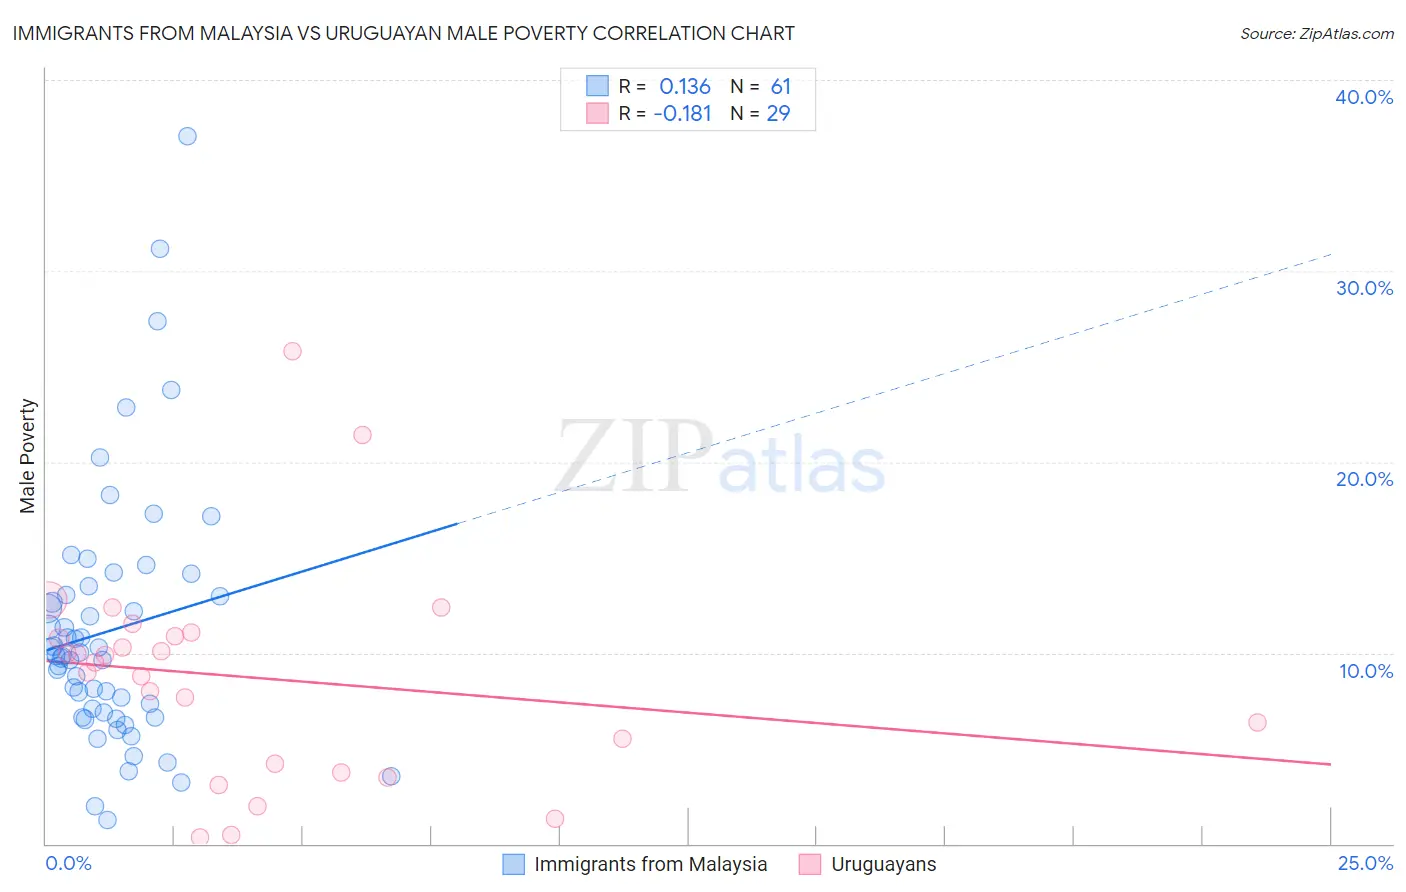
Immigrants from Malaysia vs Uruguayan Male Poverty Correlation Chart
The statistical analysis conducted on geographies consisting of 197,921,131 people shows a poor positive correlation between the proportion of Immigrants from Malaysia and poverty level among males in the United States with a correlation coefficient (R) of 0.136 and weighted average of 11.0%. Similarly, the statistical analysis conducted on geographies consisting of 144,748,239 people shows a poor negative correlation between the proportion of Uruguayans and poverty level among males in the United States with a correlation coefficient (R) of -0.181 and weighted average of 11.2%, a difference of 1.4%.
Male Poverty Correlation Summary
| Measurement | Immigrants from Malaysia | Uruguayan |
| Minimum | 1.3% | 0.34% |
| Maximum | 37.1% | 25.8% |
| Range | 35.8% | 25.4% |
| Mean | 11.2% | 8.7% |
| Median | 9.9% | 9.5% |
| Interquartile 25% (IQ1) | 6.8% | 3.9% |
| Interquartile 75% (IQ3) | 13.2% | 11.0% |
| Interquartile Range (IQR) | 6.5% | 7.0% |
| Standard Deviation (Sample) | 6.7% | 5.6% |
| Standard Deviation (Population) | 6.6% | 5.5% |
Demographics Similar to Immigrants from Malaysia and Uruguayans by Male Poverty
In terms of male poverty, the demographic groups most similar to Immigrants from Malaysia are Immigrants from Kazakhstan (11.0%, a difference of 0.010%), Immigrants from Bosnia and Herzegovina (11.0%, a difference of 0.050%), Costa Rican (11.0%, a difference of 0.090%), Scotch-Irish (11.0%, a difference of 0.11%), and Colombian (11.0%, a difference of 0.19%). Similarly, the demographic groups most similar to Uruguayans are Immigrants from Ethiopia (11.2%, a difference of 0.040%), Pennsylvania German (11.2%, a difference of 0.060%), South American (11.1%, a difference of 0.27%), Immigrants from Colombia (11.1%, a difference of 0.31%), and Immigrants from Portugal (11.1%, a difference of 0.38%).
| Demographics | Rating | Rank | Male Poverty |
| Immigrants | Bosnia and Herzegovina | 65.2 /100 | #153 | Good 11.0% |
| Immigrants | Kazakhstan | 64.8 /100 | #154 | Good 11.0% |
| Immigrants | Malaysia | 64.7 /100 | #155 | Good 11.0% |
| Costa Ricans | 63.9 /100 | #156 | Good 11.0% |
| Scotch-Irish | 63.7 /100 | #157 | Good 11.0% |
| Colombians | 63.0 /100 | #158 | Good 11.0% |
| Taiwanese | 62.7 /100 | #159 | Good 11.0% |
| Soviet Union | 60.3 /100 | #160 | Good 11.1% |
| Immigrants | Northern Africa | 59.7 /100 | #161 | Average 11.1% |
| Immigrants | Chile | 57.4 /100 | #162 | Average 11.1% |
| Whites/Caucasians | 56.7 /100 | #163 | Average 11.1% |
| Ethiopians | 56.7 /100 | #164 | Average 11.1% |
| Immigrants | Spain | 55.5 /100 | #165 | Average 11.1% |
| Immigrants | Albania | 55.3 /100 | #166 | Average 11.1% |
| Hungarians | 55.1 /100 | #167 | Average 11.1% |
| Immigrants | Portugal | 54.9 /100 | #168 | Average 11.1% |
| Immigrants | Colombia | 54.2 /100 | #169 | Average 11.1% |
| South Americans | 53.8 /100 | #170 | Average 11.1% |
| Uruguayans | 51.0 /100 | #171 | Average 11.2% |
| Immigrants | Ethiopia | 50.7 /100 | #172 | Average 11.2% |
| Pennsylvania Germans | 50.5 /100 | #173 | Average 11.2% |