South American vs Basque Male Poverty
COMPARE
South American
Basque
Male Poverty
Male Poverty Comparison
South Americans
Basques
11.1%
MALE POVERTY
53.8/ 100
METRIC RATING
170th/ 347
METRIC RANK
10.9%
MALE POVERTY
74.6/ 100
METRIC RATING
142nd/ 347
METRIC RANK
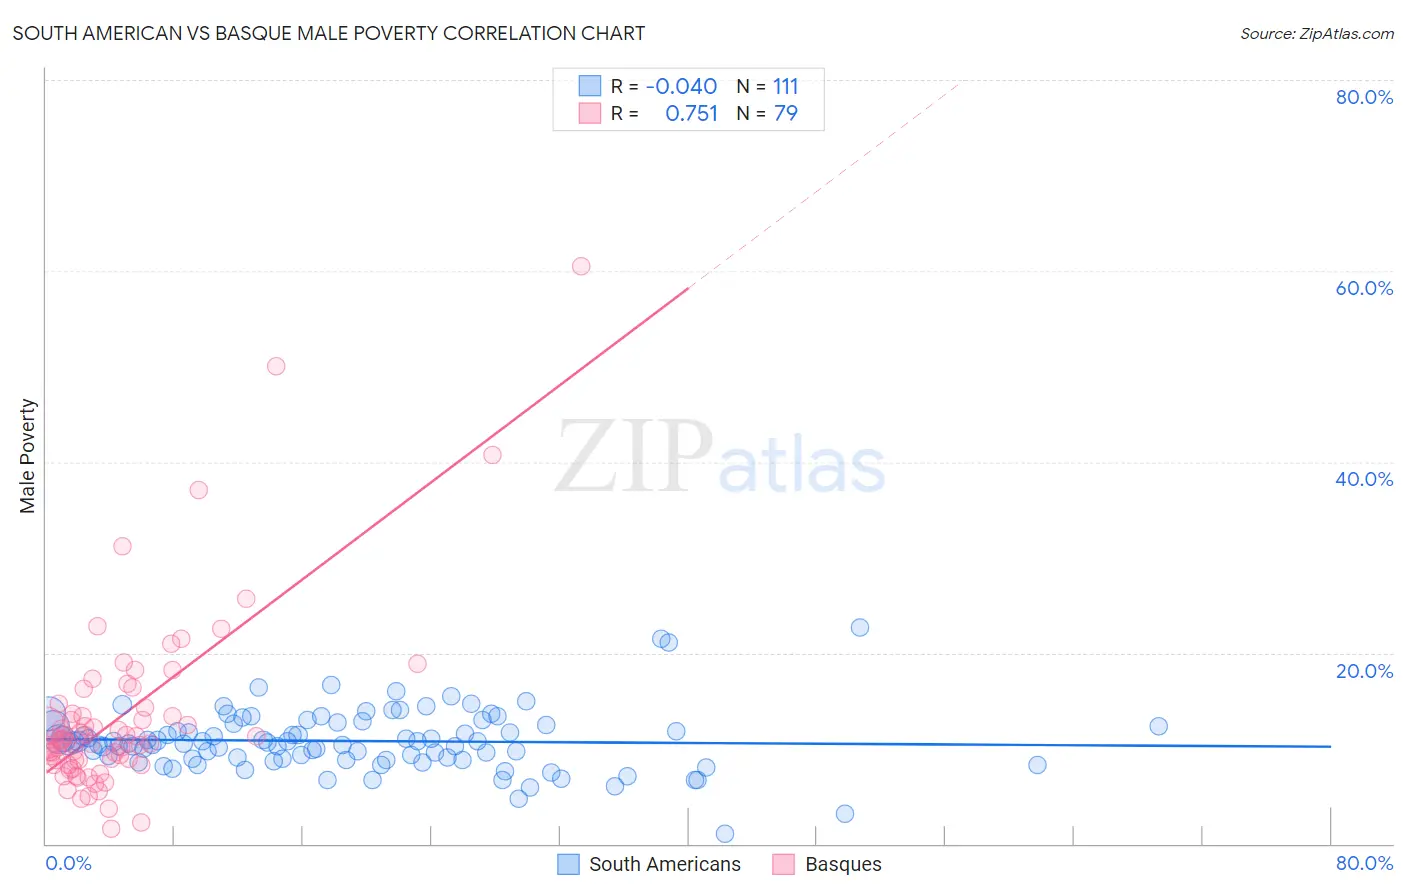
South American vs Basque Male Poverty Correlation Chart
The statistical analysis conducted on geographies consisting of 493,234,153 people shows no correlation between the proportion of South Americans and poverty level among males in the United States with a correlation coefficient (R) of -0.040 and weighted average of 11.1%. Similarly, the statistical analysis conducted on geographies consisting of 165,709,169 people shows a strong positive correlation between the proportion of Basques and poverty level among males in the United States with a correlation coefficient (R) of 0.751 and weighted average of 10.9%, a difference of 2.3%.
Male Poverty Correlation Summary
| Measurement | South American | Basque |
| Minimum | 1.0% | 1.5% |
| Maximum | 22.6% | 60.5% |
| Range | 21.6% | 59.0% |
| Mean | 10.8% | 13.3% |
| Median | 10.6% | 10.9% |
| Interquartile 25% (IQ1) | 8.9% | 8.7% |
| Interquartile 75% (IQ3) | 12.5% | 14.3% |
| Interquartile Range (IQR) | 3.6% | 5.6% |
| Standard Deviation (Sample) | 3.2% | 9.6% |
| Standard Deviation (Population) | 3.2% | 9.5% |
Similar Demographics by Male Poverty
Demographics Similar to South Americans by Male Poverty
In terms of male poverty, the demographic groups most similar to South Americans are Immigrants from Colombia (11.1%, a difference of 0.040%), Immigrants from Portugal (11.1%, a difference of 0.11%), Hungarian (11.1%, a difference of 0.14%), Immigrants from Albania (11.1%, a difference of 0.15%), and Immigrants from Spain (11.1%, a difference of 0.18%).
| Demographics | Rating | Rank | Male Poverty |
| Whites/Caucasians | 56.7 /100 | #163 | Average 11.1% |
| Ethiopians | 56.7 /100 | #164 | Average 11.1% |
| Immigrants | Spain | 55.5 /100 | #165 | Average 11.1% |
| Immigrants | Albania | 55.3 /100 | #166 | Average 11.1% |
| Hungarians | 55.1 /100 | #167 | Average 11.1% |
| Immigrants | Portugal | 54.9 /100 | #168 | Average 11.1% |
| Immigrants | Colombia | 54.2 /100 | #169 | Average 11.1% |
| South Americans | 53.8 /100 | #170 | Average 11.1% |
| Uruguayans | 51.0 /100 | #171 | Average 11.2% |
| Immigrants | Ethiopia | 50.7 /100 | #172 | Average 11.2% |
| Pennsylvania Germans | 50.5 /100 | #173 | Average 11.2% |
| Immigrants | Oceania | 50.0 /100 | #174 | Average 11.2% |
| Celtics | 47.5 /100 | #175 | Average 11.2% |
| Immigrants | Fiji | 46.0 /100 | #176 | Average 11.2% |
| Lebanese | 45.6 /100 | #177 | Average 11.2% |
Demographics Similar to Basques by Male Poverty
In terms of male poverty, the demographic groups most similar to Basques are Immigrants from France (10.9%, a difference of 0.17%), Tlingit-Haida (10.9%, a difference of 0.20%), Afghan (10.9%, a difference of 0.34%), Samoan (10.9%, a difference of 0.36%), and Immigrants from Germany (10.9%, a difference of 0.38%).
| Demographics | Rating | Rank | Male Poverty |
| Brazilians | 82.7 /100 | #135 | Excellent 10.8% |
| Immigrants | Israel | 80.9 /100 | #136 | Excellent 10.8% |
| Immigrants | Switzerland | 79.2 /100 | #137 | Good 10.8% |
| Yugoslavians | 78.2 /100 | #138 | Good 10.8% |
| Immigrants | Jordan | 77.5 /100 | #139 | Good 10.8% |
| Tlingit-Haida | 76.1 /100 | #140 | Good 10.9% |
| Immigrants | France | 75.8 /100 | #141 | Good 10.9% |
| Basques | 74.6 /100 | #142 | Good 10.9% |
| Afghans | 71.9 /100 | #143 | Good 10.9% |
| Samoans | 71.8 /100 | #144 | Good 10.9% |
| Immigrants | Germany | 71.6 /100 | #145 | Good 10.9% |
| Syrians | 71.4 /100 | #146 | Good 10.9% |
| Icelanders | 68.5 /100 | #147 | Good 11.0% |
| Armenians | 68.0 /100 | #148 | Good 11.0% |
| Immigrants | Venezuela | 67.9 /100 | #149 | Good 11.0% |