Immigrants from Honduras vs Uruguayan Male Poverty
COMPARE
Immigrants from Honduras
Uruguayan
Male Poverty
Male Poverty Comparison
Immigrants from Honduras
Uruguayans
14.6%
MALE POVERTY
0.0/ 100
METRIC RATING
314th/ 347
METRIC RANK
11.2%
MALE POVERTY
51.0/ 100
METRIC RATING
171st/ 347
METRIC RANK
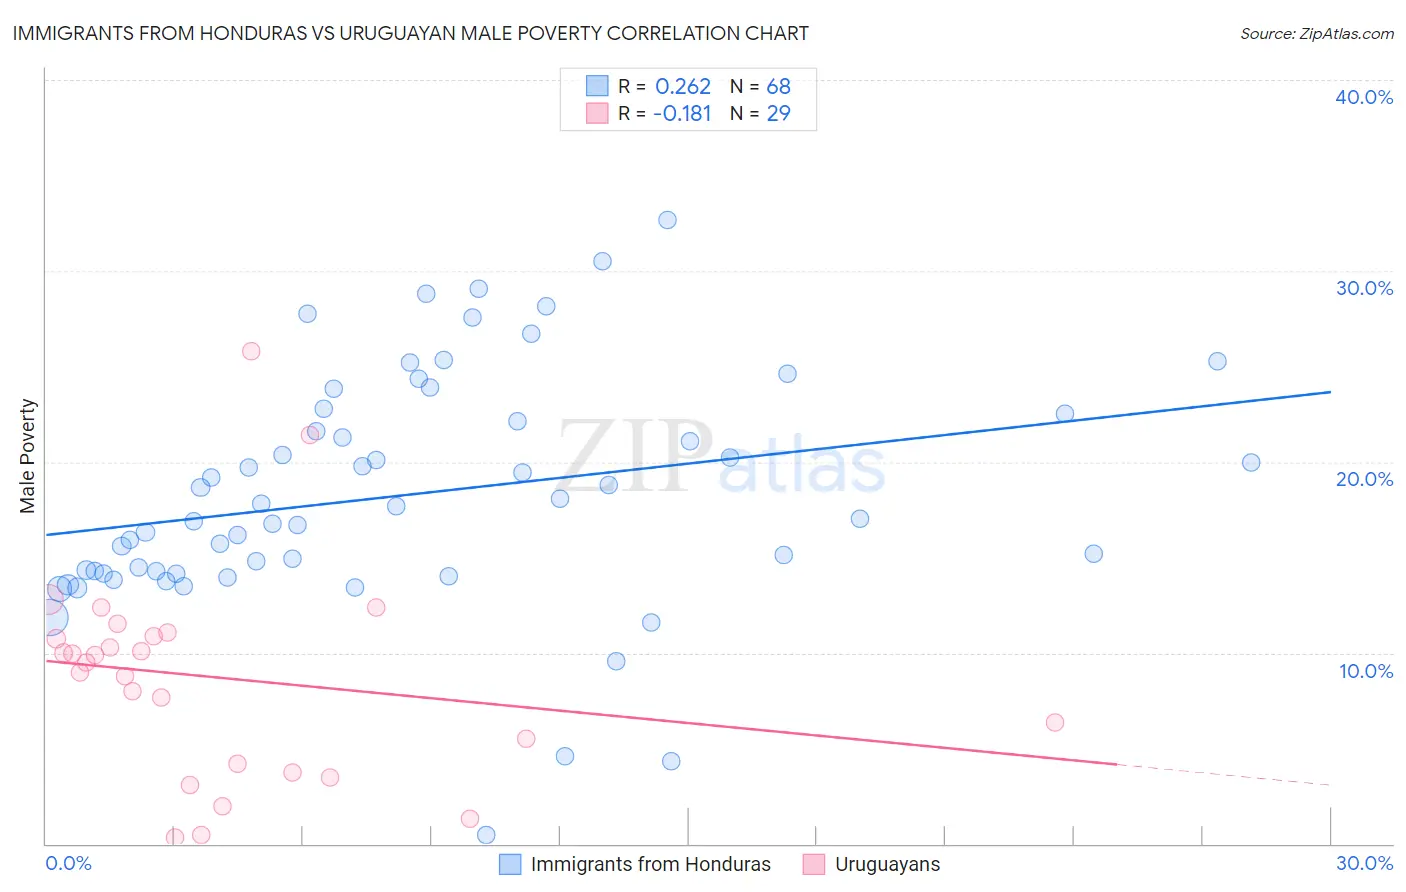
Immigrants from Honduras vs Uruguayan Male Poverty Correlation Chart
The statistical analysis conducted on geographies consisting of 322,443,990 people shows a weak positive correlation between the proportion of Immigrants from Honduras and poverty level among males in the United States with a correlation coefficient (R) of 0.262 and weighted average of 14.6%. Similarly, the statistical analysis conducted on geographies consisting of 144,748,239 people shows a poor negative correlation between the proportion of Uruguayans and poverty level among males in the United States with a correlation coefficient (R) of -0.181 and weighted average of 11.2%, a difference of 30.5%.
Male Poverty Correlation Summary
| Measurement | Immigrants from Honduras | Uruguayan |
| Minimum | 0.43% | 0.34% |
| Maximum | 32.7% | 25.8% |
| Range | 32.3% | 25.4% |
| Mean | 18.3% | 8.7% |
| Median | 17.4% | 9.5% |
| Interquartile 25% (IQ1) | 14.2% | 3.9% |
| Interquartile 75% (IQ3) | 22.3% | 11.0% |
| Interquartile Range (IQR) | 8.1% | 7.0% |
| Standard Deviation (Sample) | 6.2% | 5.6% |
| Standard Deviation (Population) | 6.1% | 5.5% |
Similar Demographics by Male Poverty
Demographics Similar to Immigrants from Honduras by Male Poverty
In terms of male poverty, the demographic groups most similar to Immigrants from Honduras are Immigrants from Somalia (14.6%, a difference of 0.040%), Chippewa (14.6%, a difference of 0.080%), British West Indian (14.6%, a difference of 0.10%), Immigrants from Dominica (14.7%, a difference of 0.78%), and Immigrants from Grenada (14.7%, a difference of 0.84%).
| Demographics | Rating | Rank | Male Poverty |
| Dutch West Indians | 0.0 /100 | #307 | Tragic 14.2% |
| Africans | 0.0 /100 | #308 | Tragic 14.2% |
| Somalis | 0.0 /100 | #309 | Tragic 14.3% |
| Seminole | 0.0 /100 | #310 | Tragic 14.3% |
| Hondurans | 0.0 /100 | #311 | Tragic 14.3% |
| Choctaw | 0.0 /100 | #312 | Tragic 14.4% |
| Immigrants | Somalia | 0.0 /100 | #313 | Tragic 14.6% |
| Immigrants | Honduras | 0.0 /100 | #314 | Tragic 14.6% |
| Chippewa | 0.0 /100 | #315 | Tragic 14.6% |
| British West Indians | 0.0 /100 | #316 | Tragic 14.6% |
| Immigrants | Dominica | 0.0 /100 | #317 | Tragic 14.7% |
| Immigrants | Grenada | 0.0 /100 | #318 | Tragic 14.7% |
| U.S. Virgin Islanders | 0.0 /100 | #319 | Tragic 14.7% |
| Immigrants | Congo | 0.0 /100 | #320 | Tragic 14.7% |
| Arapaho | 0.0 /100 | #321 | Tragic 15.1% |
Demographics Similar to Uruguayans by Male Poverty
In terms of male poverty, the demographic groups most similar to Uruguayans are Immigrants from Ethiopia (11.2%, a difference of 0.040%), Pennsylvania German (11.2%, a difference of 0.060%), Immigrants from Oceania (11.2%, a difference of 0.10%), South American (11.1%, a difference of 0.27%), and Immigrants from Colombia (11.1%, a difference of 0.31%).
| Demographics | Rating | Rank | Male Poverty |
| Ethiopians | 56.7 /100 | #164 | Average 11.1% |
| Immigrants | Spain | 55.5 /100 | #165 | Average 11.1% |
| Immigrants | Albania | 55.3 /100 | #166 | Average 11.1% |
| Hungarians | 55.1 /100 | #167 | Average 11.1% |
| Immigrants | Portugal | 54.9 /100 | #168 | Average 11.1% |
| Immigrants | Colombia | 54.2 /100 | #169 | Average 11.1% |
| South Americans | 53.8 /100 | #170 | Average 11.1% |
| Uruguayans | 51.0 /100 | #171 | Average 11.2% |
| Immigrants | Ethiopia | 50.7 /100 | #172 | Average 11.2% |
| Pennsylvania Germans | 50.5 /100 | #173 | Average 11.2% |
| Immigrants | Oceania | 50.0 /100 | #174 | Average 11.2% |
| Celtics | 47.5 /100 | #175 | Average 11.2% |
| Immigrants | Fiji | 46.0 /100 | #176 | Average 11.2% |
| Lebanese | 45.6 /100 | #177 | Average 11.2% |
| Immigrants | Cameroon | 44.5 /100 | #178 | Average 11.2% |