South American vs Sierra Leonean Male Poverty
COMPARE
South American
Sierra Leonean
Male Poverty
Male Poverty Comparison
South Americans
Sierra Leoneans
11.1%
MALE POVERTY
53.8/ 100
METRIC RATING
170th/ 347
METRIC RANK
11.4%
MALE POVERTY
29.9/ 100
METRIC RATING
188th/ 347
METRIC RANK
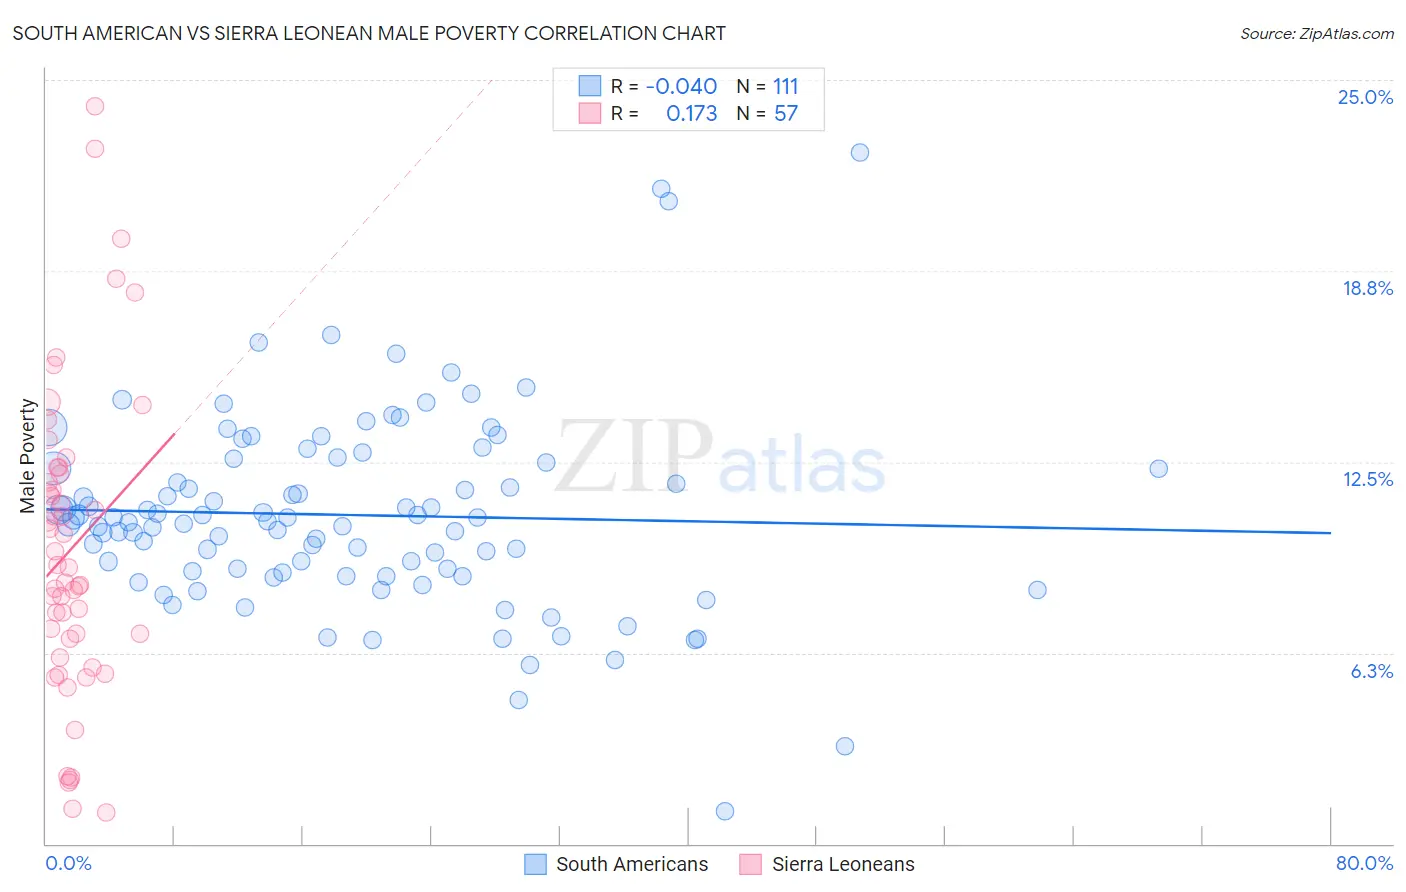
South American vs Sierra Leonean Male Poverty Correlation Chart
The statistical analysis conducted on geographies consisting of 493,234,153 people shows no correlation between the proportion of South Americans and poverty level among males in the United States with a correlation coefficient (R) of -0.040 and weighted average of 11.1%. Similarly, the statistical analysis conducted on geographies consisting of 83,343,100 people shows a poor positive correlation between the proportion of Sierra Leoneans and poverty level among males in the United States with a correlation coefficient (R) of 0.173 and weighted average of 11.4%, a difference of 2.5%.
Male Poverty Correlation Summary
| Measurement | South American | Sierra Leonean |
| Minimum | 1.0% | 1.0% |
| Maximum | 22.6% | 24.2% |
| Range | 21.6% | 23.1% |
| Mean | 10.8% | 9.7% |
| Median | 10.6% | 9.0% |
| Interquartile 25% (IQ1) | 8.9% | 6.4% |
| Interquartile 75% (IQ3) | 12.5% | 12.2% |
| Interquartile Range (IQR) | 3.6% | 5.8% |
| Standard Deviation (Sample) | 3.2% | 5.0% |
| Standard Deviation (Population) | 3.2% | 5.0% |
Demographics Similar to South Americans and Sierra Leoneans by Male Poverty
In terms of male poverty, the demographic groups most similar to South Americans are Immigrants from Colombia (11.1%, a difference of 0.040%), Uruguayan (11.2%, a difference of 0.27%), Immigrants from Ethiopia (11.2%, a difference of 0.30%), Pennsylvania German (11.2%, a difference of 0.32%), and Immigrants from Oceania (11.2%, a difference of 0.37%). Similarly, the demographic groups most similar to Sierra Leoneans are Hawaiian (11.4%, a difference of 0.18%), Immigrants from Iraq (11.4%, a difference of 0.22%), Immigrants from Sierra Leone (11.4%, a difference of 0.33%), Immigrants from Afghanistan (11.4%, a difference of 0.38%), and Immigrants from South America (11.3%, a difference of 0.77%).
| Demographics | Rating | Rank | Male Poverty |
| Immigrants | Colombia | 54.2 /100 | #169 | Average 11.1% |
| South Americans | 53.8 /100 | #170 | Average 11.1% |
| Uruguayans | 51.0 /100 | #171 | Average 11.2% |
| Immigrants | Ethiopia | 50.7 /100 | #172 | Average 11.2% |
| Pennsylvania Germans | 50.5 /100 | #173 | Average 11.2% |
| Immigrants | Oceania | 50.0 /100 | #174 | Average 11.2% |
| Celtics | 47.5 /100 | #175 | Average 11.2% |
| Immigrants | Fiji | 46.0 /100 | #176 | Average 11.2% |
| Lebanese | 45.6 /100 | #177 | Average 11.2% |
| Immigrants | Cameroon | 44.5 /100 | #178 | Average 11.2% |
| Immigrants | Syria | 40.3 /100 | #179 | Average 11.3% |
| Immigrants | Morocco | 40.1 /100 | #180 | Average 11.3% |
| Immigrants | Costa Rica | 39.5 /100 | #181 | Fair 11.3% |
| Mongolians | 39.0 /100 | #182 | Fair 11.3% |
| Kenyans | 38.4 /100 | #183 | Fair 11.3% |
| Immigrants | South America | 36.9 /100 | #184 | Fair 11.3% |
| Immigrants | Afghanistan | 33.3 /100 | #185 | Fair 11.4% |
| Immigrants | Sierra Leone | 32.9 /100 | #186 | Fair 11.4% |
| Immigrants | Iraq | 31.9 /100 | #187 | Fair 11.4% |
| Sierra Leoneans | 29.9 /100 | #188 | Fair 11.4% |
| Hawaiians | 28.3 /100 | #189 | Fair 11.4% |