Immigrants from Southern Europe vs Uruguayan Male Poverty
COMPARE
Immigrants from Southern Europe
Uruguayan
Male Poverty
Male Poverty Comparison
Immigrants from Southern Europe
Uruguayans
10.5%
MALE POVERTY
91.3/ 100
METRIC RATING
106th/ 347
METRIC RANK
11.2%
MALE POVERTY
51.0/ 100
METRIC RATING
171st/ 347
METRIC RANK
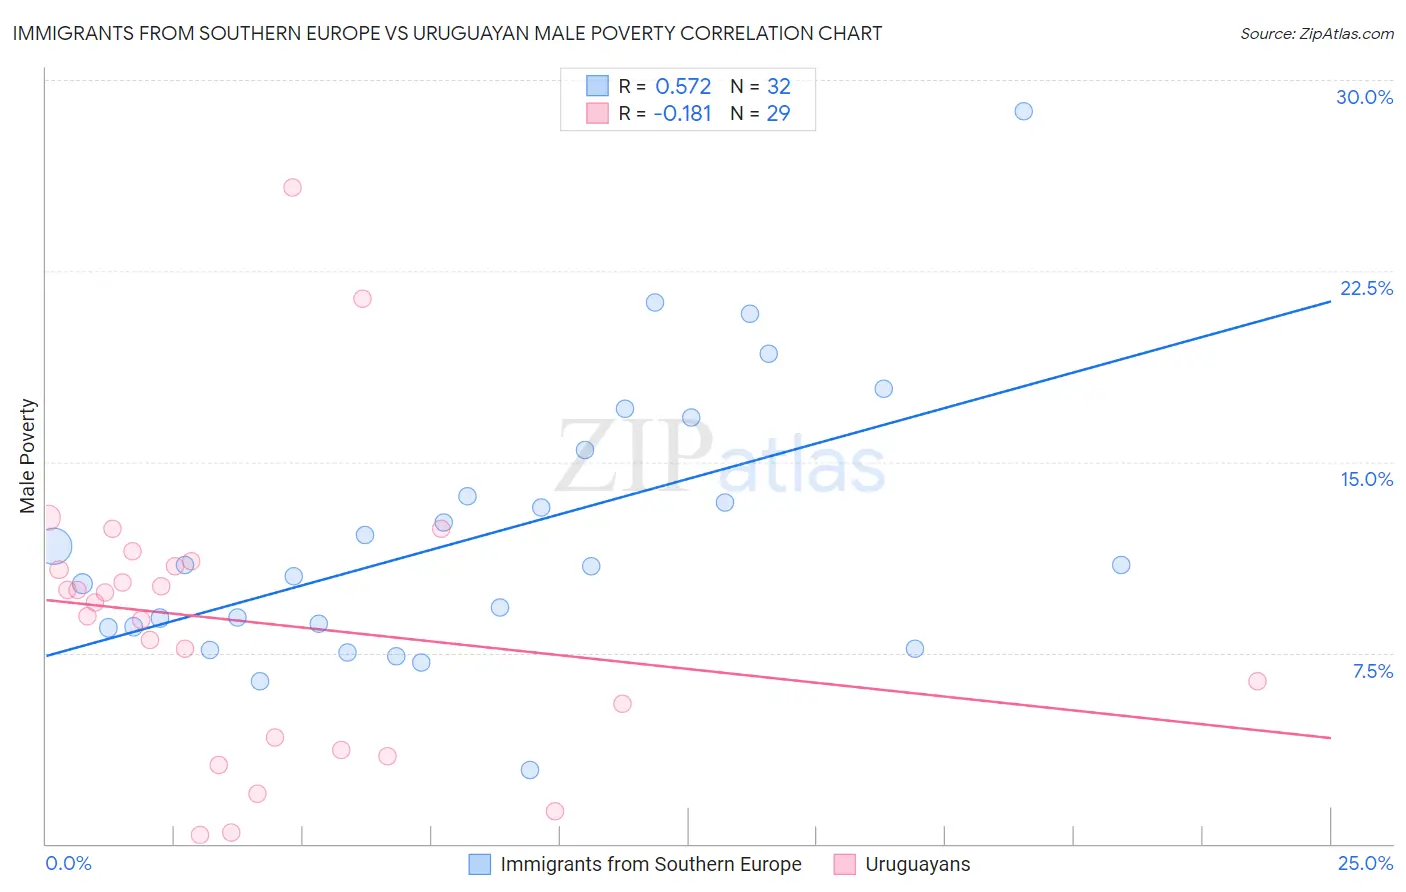
Immigrants from Southern Europe vs Uruguayan Male Poverty Correlation Chart
The statistical analysis conducted on geographies consisting of 402,406,508 people shows a substantial positive correlation between the proportion of Immigrants from Southern Europe and poverty level among males in the United States with a correlation coefficient (R) of 0.572 and weighted average of 10.5%. Similarly, the statistical analysis conducted on geographies consisting of 144,748,239 people shows a poor negative correlation between the proportion of Uruguayans and poverty level among males in the United States with a correlation coefficient (R) of -0.181 and weighted average of 11.2%, a difference of 6.0%.
Male Poverty Correlation Summary
| Measurement | Immigrants from Southern Europe | Uruguayan |
| Minimum | 2.9% | 0.34% |
| Maximum | 28.8% | 25.8% |
| Range | 25.9% | 25.4% |
| Mean | 12.1% | 8.7% |
| Median | 10.9% | 9.5% |
| Interquartile 25% (IQ1) | 8.5% | 3.9% |
| Interquartile 75% (IQ3) | 14.6% | 11.0% |
| Interquartile Range (IQR) | 6.1% | 7.0% |
| Standard Deviation (Sample) | 5.4% | 5.6% |
| Standard Deviation (Population) | 5.3% | 5.5% |
Similar Demographics by Male Poverty
Demographics Similar to Immigrants from Southern Europe by Male Poverty
In terms of male poverty, the demographic groups most similar to Immigrants from Southern Europe are Laotian (10.5%, a difference of 0.010%), Portuguese (10.6%, a difference of 0.080%), Canadian (10.5%, a difference of 0.11%), Welsh (10.5%, a difference of 0.12%), and Slavic (10.5%, a difference of 0.13%).
| Demographics | Rating | Rank | Male Poverty |
| Immigrants | Indonesia | 93.3 /100 | #99 | Exceptional 10.5% |
| Immigrants | Latvia | 92.8 /100 | #100 | Exceptional 10.5% |
| Immigrants | Zimbabwe | 92.0 /100 | #101 | Exceptional 10.5% |
| French Canadians | 91.9 /100 | #102 | Exceptional 10.5% |
| Slavs | 91.7 /100 | #103 | Exceptional 10.5% |
| Welsh | 91.6 /100 | #104 | Exceptional 10.5% |
| Canadians | 91.6 /100 | #105 | Exceptional 10.5% |
| Immigrants | Southern Europe | 91.3 /100 | #106 | Exceptional 10.5% |
| Laotians | 91.2 /100 | #107 | Exceptional 10.5% |
| Portuguese | 91.0 /100 | #108 | Exceptional 10.6% |
| Albanians | 90.6 /100 | #109 | Exceptional 10.6% |
| Argentineans | 90.1 /100 | #110 | Exceptional 10.6% |
| Immigrants | Argentina | 89.8 /100 | #111 | Excellent 10.6% |
| Immigrants | Turkey | 89.5 /100 | #112 | Excellent 10.6% |
| Palestinians | 89.1 /100 | #113 | Excellent 10.6% |
Demographics Similar to Uruguayans by Male Poverty
In terms of male poverty, the demographic groups most similar to Uruguayans are Immigrants from Ethiopia (11.2%, a difference of 0.040%), Pennsylvania German (11.2%, a difference of 0.060%), Immigrants from Oceania (11.2%, a difference of 0.10%), South American (11.1%, a difference of 0.27%), and Immigrants from Colombia (11.1%, a difference of 0.31%).
| Demographics | Rating | Rank | Male Poverty |
| Ethiopians | 56.7 /100 | #164 | Average 11.1% |
| Immigrants | Spain | 55.5 /100 | #165 | Average 11.1% |
| Immigrants | Albania | 55.3 /100 | #166 | Average 11.1% |
| Hungarians | 55.1 /100 | #167 | Average 11.1% |
| Immigrants | Portugal | 54.9 /100 | #168 | Average 11.1% |
| Immigrants | Colombia | 54.2 /100 | #169 | Average 11.1% |
| South Americans | 53.8 /100 | #170 | Average 11.1% |
| Uruguayans | 51.0 /100 | #171 | Average 11.2% |
| Immigrants | Ethiopia | 50.7 /100 | #172 | Average 11.2% |
| Pennsylvania Germans | 50.5 /100 | #173 | Average 11.2% |
| Immigrants | Oceania | 50.0 /100 | #174 | Average 11.2% |
| Celtics | 47.5 /100 | #175 | Average 11.2% |
| Immigrants | Fiji | 46.0 /100 | #176 | Average 11.2% |
| Lebanese | 45.6 /100 | #177 | Average 11.2% |
| Immigrants | Cameroon | 44.5 /100 | #178 | Average 11.2% |