Immigrants from Argentina vs Uruguayan Male Poverty
COMPARE
Immigrants from Argentina
Uruguayan
Male Poverty
Male Poverty Comparison
Immigrants from Argentina
Uruguayans
10.6%
MALE POVERTY
89.8/ 100
METRIC RATING
111th/ 347
METRIC RANK
11.2%
MALE POVERTY
51.0/ 100
METRIC RATING
171st/ 347
METRIC RANK
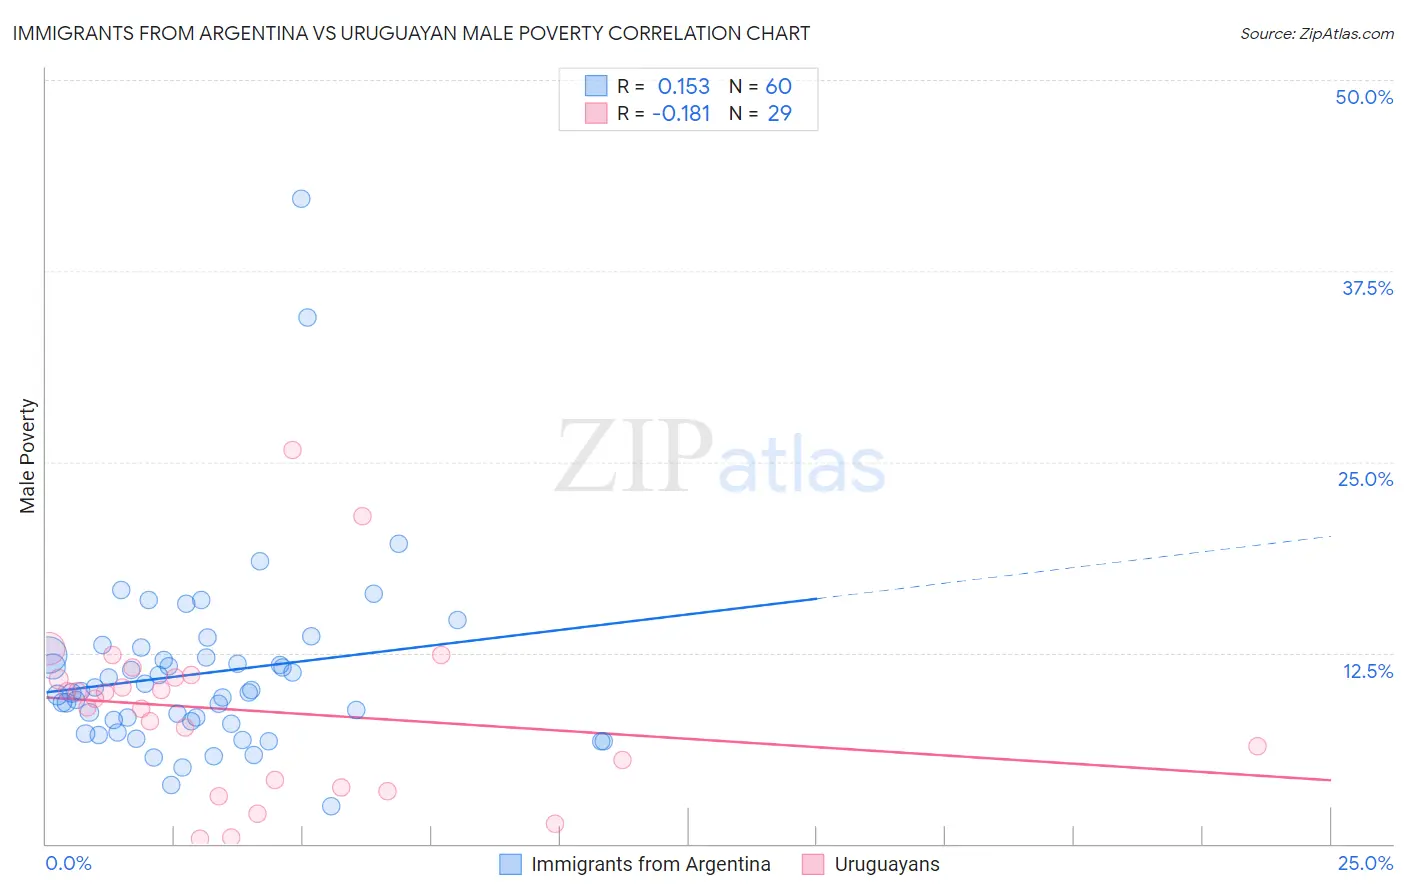
Immigrants from Argentina vs Uruguayan Male Poverty Correlation Chart
The statistical analysis conducted on geographies consisting of 264,308,619 people shows a poor positive correlation between the proportion of Immigrants from Argentina and poverty level among males in the United States with a correlation coefficient (R) of 0.153 and weighted average of 10.6%. Similarly, the statistical analysis conducted on geographies consisting of 144,748,239 people shows a poor negative correlation between the proportion of Uruguayans and poverty level among males in the United States with a correlation coefficient (R) of -0.181 and weighted average of 11.2%, a difference of 5.5%.
Male Poverty Correlation Summary
| Measurement | Immigrants from Argentina | Uruguayan |
| Minimum | 2.5% | 0.34% |
| Maximum | 42.3% | 25.8% |
| Range | 39.8% | 25.4% |
| Mean | 11.2% | 8.7% |
| Median | 9.9% | 9.5% |
| Interquartile 25% (IQ1) | 7.9% | 3.9% |
| Interquartile 75% (IQ3) | 12.3% | 11.0% |
| Interquartile Range (IQR) | 4.4% | 7.0% |
| Standard Deviation (Sample) | 6.2% | 5.6% |
| Standard Deviation (Population) | 6.2% | 5.5% |
Similar Demographics by Male Poverty
Demographics Similar to Immigrants from Argentina by Male Poverty
In terms of male poverty, the demographic groups most similar to Immigrants from Argentina are Immigrants from Turkey (10.6%, a difference of 0.080%), Argentinean (10.6%, a difference of 0.11%), Palestinian (10.6%, a difference of 0.18%), Immigrants from Brazil (10.6%, a difference of 0.20%), and Albanian (10.6%, a difference of 0.24%).
| Demographics | Rating | Rank | Male Poverty |
| Welsh | 91.6 /100 | #104 | Exceptional 10.5% |
| Canadians | 91.6 /100 | #105 | Exceptional 10.5% |
| Immigrants | Southern Europe | 91.3 /100 | #106 | Exceptional 10.5% |
| Laotians | 91.2 /100 | #107 | Exceptional 10.5% |
| Portuguese | 91.0 /100 | #108 | Exceptional 10.6% |
| Albanians | 90.6 /100 | #109 | Exceptional 10.6% |
| Argentineans | 90.1 /100 | #110 | Exceptional 10.6% |
| Immigrants | Argentina | 89.8 /100 | #111 | Excellent 10.6% |
| Immigrants | Turkey | 89.5 /100 | #112 | Excellent 10.6% |
| Palestinians | 89.1 /100 | #113 | Excellent 10.6% |
| Immigrants | Brazil | 89.0 /100 | #114 | Excellent 10.6% |
| Immigrants | Russia | 88.6 /100 | #115 | Excellent 10.6% |
| Sri Lankans | 88.1 /100 | #116 | Excellent 10.6% |
| Immigrants | South Eastern Asia | 88.1 /100 | #117 | Excellent 10.6% |
| Okinawans | 87.6 /100 | #118 | Excellent 10.7% |
Demographics Similar to Uruguayans by Male Poverty
In terms of male poverty, the demographic groups most similar to Uruguayans are Immigrants from Ethiopia (11.2%, a difference of 0.040%), Pennsylvania German (11.2%, a difference of 0.060%), Immigrants from Oceania (11.2%, a difference of 0.10%), South American (11.1%, a difference of 0.27%), and Immigrants from Colombia (11.1%, a difference of 0.31%).
| Demographics | Rating | Rank | Male Poverty |
| Ethiopians | 56.7 /100 | #164 | Average 11.1% |
| Immigrants | Spain | 55.5 /100 | #165 | Average 11.1% |
| Immigrants | Albania | 55.3 /100 | #166 | Average 11.1% |
| Hungarians | 55.1 /100 | #167 | Average 11.1% |
| Immigrants | Portugal | 54.9 /100 | #168 | Average 11.1% |
| Immigrants | Colombia | 54.2 /100 | #169 | Average 11.1% |
| South Americans | 53.8 /100 | #170 | Average 11.1% |
| Uruguayans | 51.0 /100 | #171 | Average 11.2% |
| Immigrants | Ethiopia | 50.7 /100 | #172 | Average 11.2% |
| Pennsylvania Germans | 50.5 /100 | #173 | Average 11.2% |
| Immigrants | Oceania | 50.0 /100 | #174 | Average 11.2% |
| Celtics | 47.5 /100 | #175 | Average 11.2% |
| Immigrants | Fiji | 46.0 /100 | #176 | Average 11.2% |
| Lebanese | 45.6 /100 | #177 | Average 11.2% |
| Immigrants | Cameroon | 44.5 /100 | #178 | Average 11.2% |