South American vs Immigrants from Senegal Male Poverty
COMPARE
South American
Immigrants from Senegal
Male Poverty
Male Poverty Comparison
South Americans
Immigrants from Senegal
11.1%
MALE POVERTY
53.8/ 100
METRIC RATING
170th/ 347
METRIC RANK
14.0%
MALE POVERTY
0.0/ 100
METRIC RATING
301st/ 347
METRIC RANK
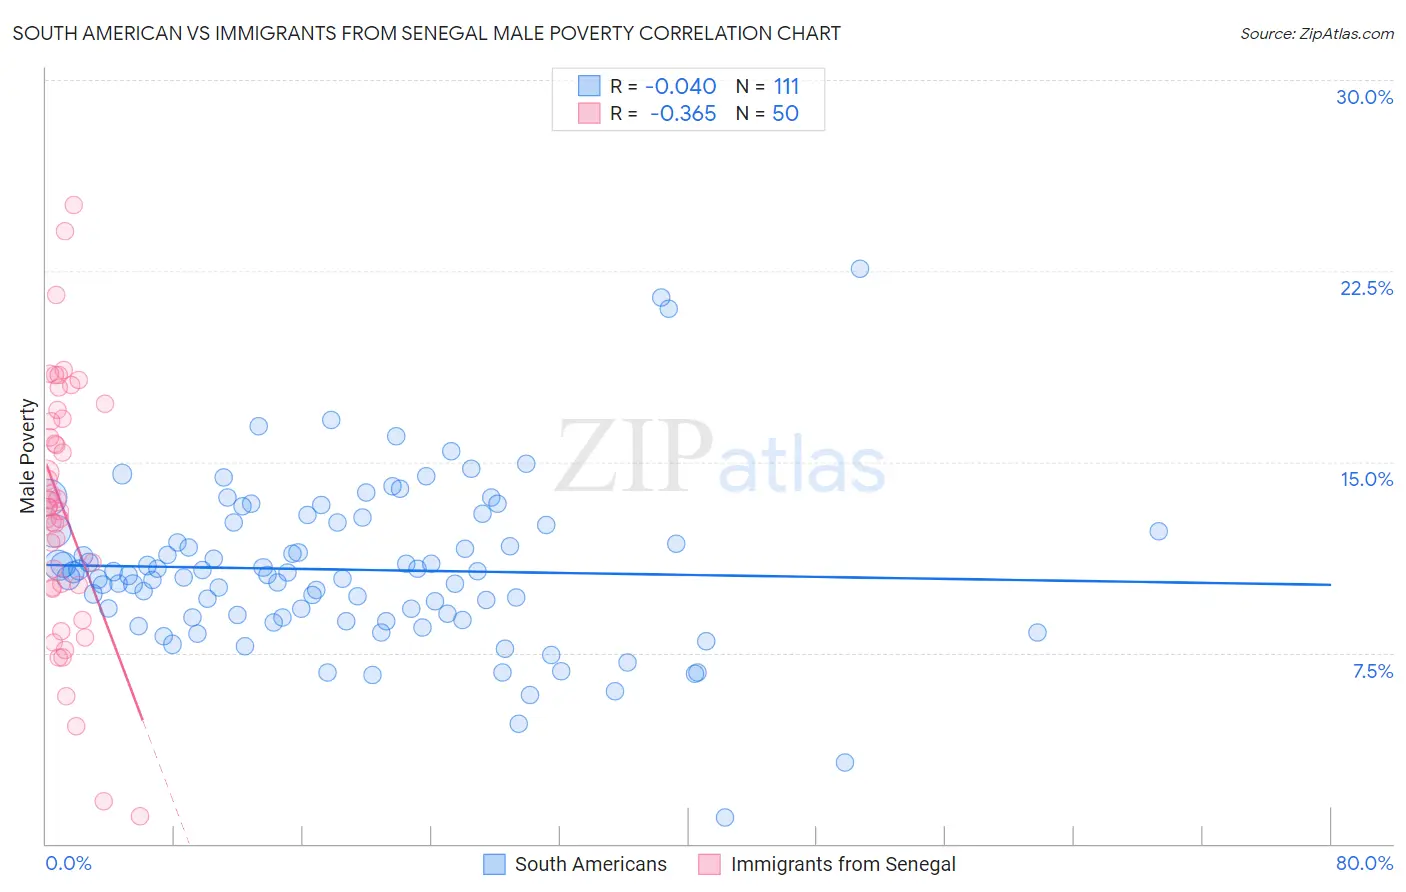
South American vs Immigrants from Senegal Male Poverty Correlation Chart
The statistical analysis conducted on geographies consisting of 493,234,153 people shows no correlation between the proportion of South Americans and poverty level among males in the United States with a correlation coefficient (R) of -0.040 and weighted average of 11.1%. Similarly, the statistical analysis conducted on geographies consisting of 90,120,671 people shows a mild negative correlation between the proportion of Immigrants from Senegal and poverty level among males in the United States with a correlation coefficient (R) of -0.365 and weighted average of 14.0%, a difference of 26.0%.
Male Poverty Correlation Summary
| Measurement | South American | Immigrants from Senegal |
| Minimum | 1.0% | 1.1% |
| Maximum | 22.6% | 25.1% |
| Range | 21.6% | 24.0% |
| Mean | 10.8% | 13.1% |
| Median | 10.6% | 13.2% |
| Interquartile 25% (IQ1) | 8.9% | 10.0% |
| Interquartile 75% (IQ3) | 12.5% | 16.7% |
| Interquartile Range (IQR) | 3.6% | 6.7% |
| Standard Deviation (Sample) | 3.2% | 5.1% |
| Standard Deviation (Population) | 3.2% | 5.0% |
Similar Demographics by Male Poverty
Demographics Similar to South Americans by Male Poverty
In terms of male poverty, the demographic groups most similar to South Americans are Immigrants from Colombia (11.1%, a difference of 0.040%), Immigrants from Portugal (11.1%, a difference of 0.11%), Hungarian (11.1%, a difference of 0.14%), Immigrants from Albania (11.1%, a difference of 0.15%), and Immigrants from Spain (11.1%, a difference of 0.18%).
| Demographics | Rating | Rank | Male Poverty |
| Whites/Caucasians | 56.7 /100 | #163 | Average 11.1% |
| Ethiopians | 56.7 /100 | #164 | Average 11.1% |
| Immigrants | Spain | 55.5 /100 | #165 | Average 11.1% |
| Immigrants | Albania | 55.3 /100 | #166 | Average 11.1% |
| Hungarians | 55.1 /100 | #167 | Average 11.1% |
| Immigrants | Portugal | 54.9 /100 | #168 | Average 11.1% |
| Immigrants | Colombia | 54.2 /100 | #169 | Average 11.1% |
| South Americans | 53.8 /100 | #170 | Average 11.1% |
| Uruguayans | 51.0 /100 | #171 | Average 11.2% |
| Immigrants | Ethiopia | 50.7 /100 | #172 | Average 11.2% |
| Pennsylvania Germans | 50.5 /100 | #173 | Average 11.2% |
| Immigrants | Oceania | 50.0 /100 | #174 | Average 11.2% |
| Celtics | 47.5 /100 | #175 | Average 11.2% |
| Immigrants | Fiji | 46.0 /100 | #176 | Average 11.2% |
| Lebanese | 45.6 /100 | #177 | Average 11.2% |
Demographics Similar to Immigrants from Senegal by Male Poverty
In terms of male poverty, the demographic groups most similar to Immigrants from Senegal are Immigrants from Caribbean (14.0%, a difference of 0.060%), Immigrants from Mexico (14.0%, a difference of 0.070%), Bahamian (14.1%, a difference of 0.10%), Immigrants from Guatemala (14.0%, a difference of 0.18%), and Senegalese (14.1%, a difference of 0.20%).
| Demographics | Rating | Rank | Male Poverty |
| Hispanics or Latinos | 0.0 /100 | #294 | Tragic 13.9% |
| Immigrants | Central America | 0.0 /100 | #295 | Tragic 13.9% |
| Cajuns | 0.0 /100 | #296 | Tragic 13.9% |
| Inupiat | 0.0 /100 | #297 | Tragic 14.0% |
| Blackfeet | 0.0 /100 | #298 | Tragic 14.0% |
| Immigrants | Guatemala | 0.0 /100 | #299 | Tragic 14.0% |
| Immigrants | Mexico | 0.0 /100 | #300 | Tragic 14.0% |
| Immigrants | Senegal | 0.0 /100 | #301 | Tragic 14.0% |
| Immigrants | Caribbean | 0.0 /100 | #302 | Tragic 14.0% |
| Bahamians | 0.0 /100 | #303 | Tragic 14.1% |
| Senegalese | 0.0 /100 | #304 | Tragic 14.1% |
| Immigrants | Bangladesh | 0.0 /100 | #305 | Tragic 14.1% |
| Creek | 0.0 /100 | #306 | Tragic 14.1% |
| Dutch West Indians | 0.0 /100 | #307 | Tragic 14.2% |
| Africans | 0.0 /100 | #308 | Tragic 14.2% |