Cherokee vs Basque Male Poverty
COMPARE
Cherokee
Basque
Male Poverty
Male Poverty Comparison
Cherokee
Basques
13.1%
MALE POVERTY
0.1/ 100
METRIC RATING
259th/ 347
METRIC RANK
10.9%
MALE POVERTY
74.6/ 100
METRIC RATING
142nd/ 347
METRIC RANK
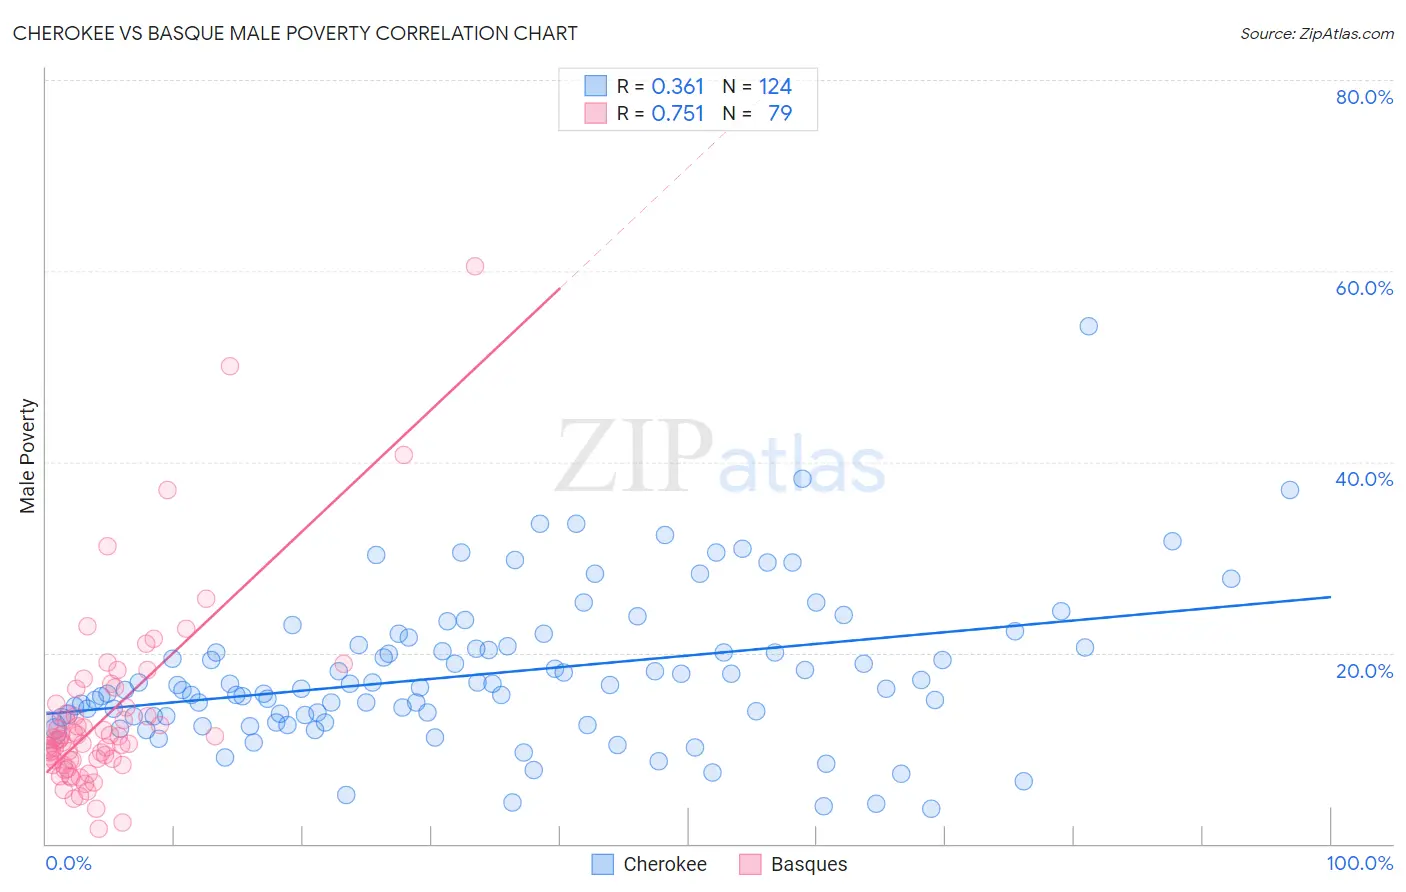
Cherokee vs Basque Male Poverty Correlation Chart
The statistical analysis conducted on geographies consisting of 493,122,545 people shows a mild positive correlation between the proportion of Cherokee and poverty level among males in the United States with a correlation coefficient (R) of 0.361 and weighted average of 13.1%. Similarly, the statistical analysis conducted on geographies consisting of 165,709,169 people shows a strong positive correlation between the proportion of Basques and poverty level among males in the United States with a correlation coefficient (R) of 0.751 and weighted average of 10.9%, a difference of 20.2%.
Male Poverty Correlation Summary
| Measurement | Cherokee | Basque |
| Minimum | 3.6% | 1.5% |
| Maximum | 54.2% | 60.5% |
| Range | 50.6% | 59.0% |
| Mean | 17.8% | 13.3% |
| Median | 16.3% | 10.9% |
| Interquartile 25% (IQ1) | 13.4% | 8.7% |
| Interquartile 75% (IQ3) | 20.6% | 14.3% |
| Interquartile Range (IQR) | 7.2% | 5.6% |
| Standard Deviation (Sample) | 7.8% | 9.6% |
| Standard Deviation (Population) | 7.8% | 9.5% |
Similar Demographics by Male Poverty
Demographics Similar to Cherokee by Male Poverty
In terms of male poverty, the demographic groups most similar to Cherokee are Ottawa (13.1%, a difference of 0.11%), Trinidadian and Tobagonian (13.1%, a difference of 0.13%), Cape Verdean (13.1%, a difference of 0.16%), Spanish American Indian (13.1%, a difference of 0.18%), and Immigrants from Trinidad and Tobago (13.1%, a difference of 0.29%).
| Demographics | Rating | Rank | Male Poverty |
| Immigrants | Ecuador | 0.2 /100 | #252 | Tragic 12.9% |
| Immigrants | Ghana | 0.2 /100 | #253 | Tragic 12.9% |
| Mexican American Indians | 0.1 /100 | #254 | Tragic 13.0% |
| Immigrants | Liberia | 0.1 /100 | #255 | Tragic 13.0% |
| Immigrants | Burma/Myanmar | 0.1 /100 | #256 | Tragic 13.0% |
| Immigrants | Trinidad and Tobago | 0.1 /100 | #257 | Tragic 13.1% |
| Cape Verdeans | 0.1 /100 | #258 | Tragic 13.1% |
| Cherokee | 0.1 /100 | #259 | Tragic 13.1% |
| Ottawa | 0.1 /100 | #260 | Tragic 13.1% |
| Trinidadians and Tobagonians | 0.1 /100 | #261 | Tragic 13.1% |
| Spanish American Indians | 0.1 /100 | #262 | Tragic 13.1% |
| Central Americans | 0.1 /100 | #263 | Tragic 13.2% |
| Iroquois | 0.1 /100 | #264 | Tragic 13.2% |
| Jamaicans | 0.1 /100 | #265 | Tragic 13.2% |
| Immigrants | Guyana | 0.1 /100 | #266 | Tragic 13.2% |
Demographics Similar to Basques by Male Poverty
In terms of male poverty, the demographic groups most similar to Basques are Immigrants from France (10.9%, a difference of 0.17%), Tlingit-Haida (10.9%, a difference of 0.20%), Afghan (10.9%, a difference of 0.34%), Samoan (10.9%, a difference of 0.36%), and Immigrants from Germany (10.9%, a difference of 0.38%).
| Demographics | Rating | Rank | Male Poverty |
| Brazilians | 82.7 /100 | #135 | Excellent 10.8% |
| Immigrants | Israel | 80.9 /100 | #136 | Excellent 10.8% |
| Immigrants | Switzerland | 79.2 /100 | #137 | Good 10.8% |
| Yugoslavians | 78.2 /100 | #138 | Good 10.8% |
| Immigrants | Jordan | 77.5 /100 | #139 | Good 10.8% |
| Tlingit-Haida | 76.1 /100 | #140 | Good 10.9% |
| Immigrants | France | 75.8 /100 | #141 | Good 10.9% |
| Basques | 74.6 /100 | #142 | Good 10.9% |
| Afghans | 71.9 /100 | #143 | Good 10.9% |
| Samoans | 71.8 /100 | #144 | Good 10.9% |
| Immigrants | Germany | 71.6 /100 | #145 | Good 10.9% |
| Syrians | 71.4 /100 | #146 | Good 10.9% |
| Icelanders | 68.5 /100 | #147 | Good 11.0% |
| Armenians | 68.0 /100 | #148 | Good 11.0% |
| Immigrants | Venezuela | 67.9 /100 | #149 | Good 11.0% |