Immigrants from Scotland vs Basque Male Poverty
COMPARE
Immigrants from Scotland
Basque
Male Poverty
Male Poverty Comparison
Immigrants from Scotland
Basques
9.6%
MALE POVERTY
99.7/ 100
METRIC RATING
21st/ 347
METRIC RANK
10.9%
MALE POVERTY
74.6/ 100
METRIC RATING
142nd/ 347
METRIC RANK
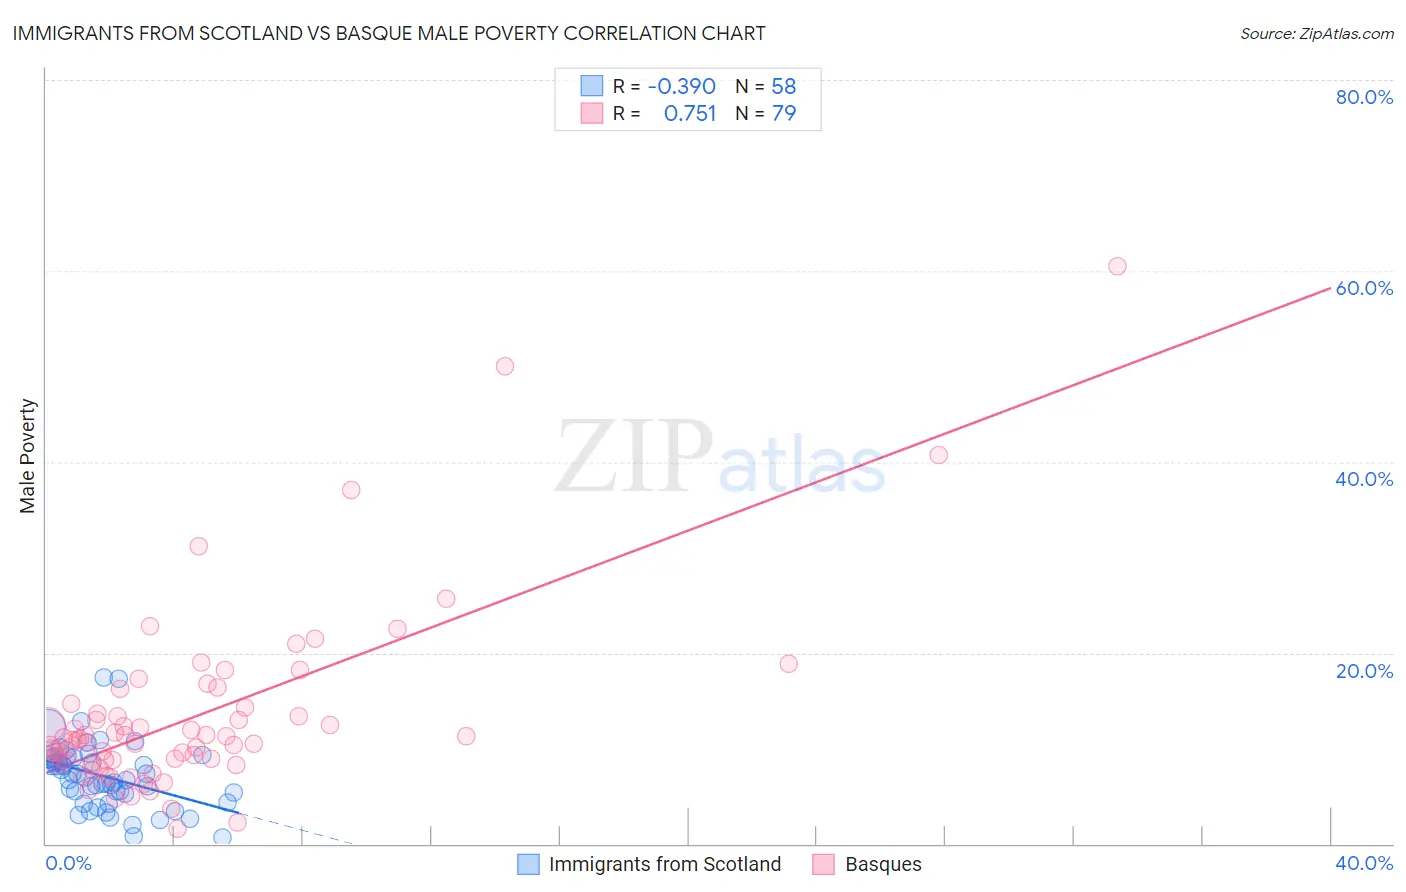
Immigrants from Scotland vs Basque Male Poverty Correlation Chart
The statistical analysis conducted on geographies consisting of 196,352,980 people shows a mild negative correlation between the proportion of Immigrants from Scotland and poverty level among males in the United States with a correlation coefficient (R) of -0.390 and weighted average of 9.6%. Similarly, the statistical analysis conducted on geographies consisting of 165,709,169 people shows a strong positive correlation between the proportion of Basques and poverty level among males in the United States with a correlation coefficient (R) of 0.751 and weighted average of 10.9%, a difference of 13.5%.
Male Poverty Correlation Summary
| Measurement | Immigrants from Scotland | Basque |
| Minimum | 0.60% | 1.5% |
| Maximum | 17.4% | 60.5% |
| Range | 16.8% | 59.0% |
| Mean | 7.1% | 13.3% |
| Median | 6.8% | 10.9% |
| Interquartile 25% (IQ1) | 5.3% | 8.7% |
| Interquartile 75% (IQ3) | 9.0% | 14.3% |
| Interquartile Range (IQR) | 3.7% | 5.6% |
| Standard Deviation (Sample) | 3.4% | 9.6% |
| Standard Deviation (Population) | 3.3% | 9.5% |
Similar Demographics by Male Poverty
Demographics Similar to Immigrants from Scotland by Male Poverty
In terms of male poverty, the demographic groups most similar to Immigrants from Scotland are Croatian (9.6%, a difference of 0.25%), Latvian (9.6%, a difference of 0.26%), Italian (9.6%, a difference of 0.26%), Swedish (9.6%, a difference of 0.34%), and Immigrants from Hong Kong (9.6%, a difference of 0.36%).
| Demographics | Rating | Rank | Male Poverty |
| Immigrants | North Macedonia | 99.8 /100 | #14 | Exceptional 9.4% |
| Bhutanese | 99.8 /100 | #15 | Exceptional 9.5% |
| Luxembourgers | 99.8 /100 | #16 | Exceptional 9.5% |
| Norwegians | 99.8 /100 | #17 | Exceptional 9.5% |
| Lithuanians | 99.8 /100 | #18 | Exceptional 9.5% |
| Immigrants | Hong Kong | 99.7 /100 | #19 | Exceptional 9.6% |
| Latvians | 99.7 /100 | #20 | Exceptional 9.6% |
| Immigrants | Scotland | 99.7 /100 | #21 | Exceptional 9.6% |
| Croatians | 99.7 /100 | #22 | Exceptional 9.6% |
| Italians | 99.7 /100 | #23 | Exceptional 9.6% |
| Swedes | 99.7 /100 | #24 | Exceptional 9.6% |
| Eastern Europeans | 99.6 /100 | #25 | Exceptional 9.6% |
| Burmese | 99.6 /100 | #26 | Exceptional 9.7% |
| Danes | 99.6 /100 | #27 | Exceptional 9.7% |
| Immigrants | Korea | 99.6 /100 | #28 | Exceptional 9.7% |
Demographics Similar to Basques by Male Poverty
In terms of male poverty, the demographic groups most similar to Basques are Immigrants from France (10.9%, a difference of 0.17%), Tlingit-Haida (10.9%, a difference of 0.20%), Afghan (10.9%, a difference of 0.34%), Samoan (10.9%, a difference of 0.36%), and Immigrants from Germany (10.9%, a difference of 0.38%).
| Demographics | Rating | Rank | Male Poverty |
| Brazilians | 82.7 /100 | #135 | Excellent 10.8% |
| Immigrants | Israel | 80.9 /100 | #136 | Excellent 10.8% |
| Immigrants | Switzerland | 79.2 /100 | #137 | Good 10.8% |
| Yugoslavians | 78.2 /100 | #138 | Good 10.8% |
| Immigrants | Jordan | 77.5 /100 | #139 | Good 10.8% |
| Tlingit-Haida | 76.1 /100 | #140 | Good 10.9% |
| Immigrants | France | 75.8 /100 | #141 | Good 10.9% |
| Basques | 74.6 /100 | #142 | Good 10.9% |
| Afghans | 71.9 /100 | #143 | Good 10.9% |
| Samoans | 71.8 /100 | #144 | Good 10.9% |
| Immigrants | Germany | 71.6 /100 | #145 | Good 10.9% |
| Syrians | 71.4 /100 | #146 | Good 10.9% |
| Icelanders | 68.5 /100 | #147 | Good 11.0% |
| Armenians | 68.0 /100 | #148 | Good 11.0% |
| Immigrants | Venezuela | 67.9 /100 | #149 | Good 11.0% |