South American vs Basque Child Poverty Among Girls Under 16
COMPARE
South American
Basque
Child Poverty Among Girls Under 16
Child Poverty Among Girls Under 16 Comparison
South Americans
Basques
16.1%
CHILD POVERTY AMONG GIRLS UNDER 16
67.2/ 100
METRIC RATING
166th/ 347
METRIC RANK
15.0%
CHILD POVERTY AMONG GIRLS UNDER 16
95.9/ 100
METRIC RATING
98th/ 347
METRIC RANK
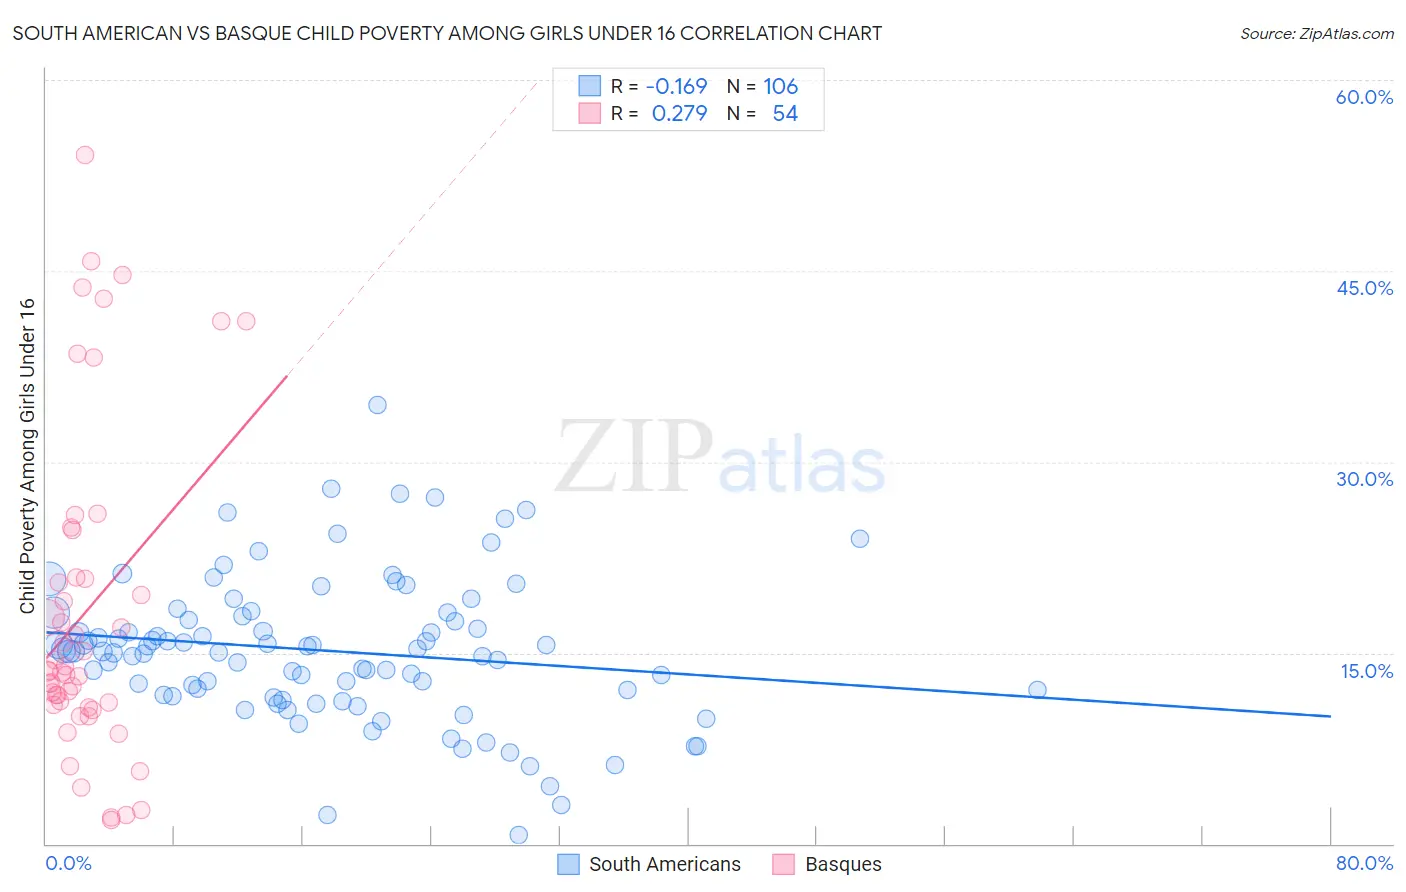
South American vs Basque Child Poverty Among Girls Under 16 Correlation Chart
The statistical analysis conducted on geographies consisting of 481,449,574 people shows a poor negative correlation between the proportion of South Americans and poverty level among girls under the age of 16 in the United States with a correlation coefficient (R) of -0.169 and weighted average of 16.1%. Similarly, the statistical analysis conducted on geographies consisting of 164,410,645 people shows a weak positive correlation between the proportion of Basques and poverty level among girls under the age of 16 in the United States with a correlation coefficient (R) of 0.279 and weighted average of 15.0%, a difference of 7.7%.
Child Poverty Among Girls Under 16 Correlation Summary
| Measurement | South American | Basque |
| Minimum | 0.69% | 1.8% |
| Maximum | 34.5% | 54.1% |
| Range | 33.8% | 52.2% |
| Mean | 15.2% | 18.3% |
| Median | 15.1% | 13.6% |
| Interquartile 25% (IQ1) | 11.7% | 10.9% |
| Interquartile 75% (IQ3) | 17.9% | 20.9% |
| Interquartile Range (IQR) | 6.2% | 9.9% |
| Standard Deviation (Sample) | 5.7% | 12.7% |
| Standard Deviation (Population) | 5.7% | 12.6% |
Similar Demographics by Child Poverty Among Girls Under 16
Demographics Similar to South Americans by Child Poverty Among Girls Under 16
In terms of child poverty among girls under 16, the demographic groups most similar to South Americans are Immigrants from Germany (16.1%, a difference of 0.020%), Immigrants from Colombia (16.1%, a difference of 0.090%), Immigrants from Oceania (16.1%, a difference of 0.16%), French Canadian (16.1%, a difference of 0.21%), and Uruguayan (16.2%, a difference of 0.32%).
| Demographics | Rating | Rank | Child Poverty Among Girls Under 16 |
| Slovaks | 75.2 /100 | #159 | Good 15.9% |
| French | 72.8 /100 | #160 | Good 16.0% |
| Immigrants | Northern Africa | 72.0 /100 | #161 | Good 16.0% |
| French Canadians | 68.7 /100 | #162 | Good 16.1% |
| Immigrants | Oceania | 68.4 /100 | #163 | Good 16.1% |
| Immigrants | Colombia | 67.8 /100 | #164 | Good 16.1% |
| Immigrants | Germany | 67.3 /100 | #165 | Good 16.1% |
| South Americans | 67.2 /100 | #166 | Good 16.1% |
| Uruguayans | 64.7 /100 | #167 | Good 16.2% |
| Yugoslavians | 64.4 /100 | #168 | Good 16.2% |
| Costa Ricans | 64.2 /100 | #169 | Good 16.2% |
| Immigrants | Venezuela | 64.2 /100 | #170 | Good 16.2% |
| Immigrants | Saudi Arabia | 64.0 /100 | #171 | Good 16.2% |
| Afghans | 62.3 /100 | #172 | Good 16.2% |
| Immigrants | South America | 55.1 /100 | #173 | Average 16.4% |
Demographics Similar to Basques by Child Poverty Among Girls Under 16
In terms of child poverty among girls under 16, the demographic groups most similar to Basques are Immigrants from Egypt (15.0%, a difference of 0.15%), Immigrants from Latvia (14.9%, a difference of 0.19%), Paraguayan (15.0%, a difference of 0.20%), Immigrants from South Africa (15.0%, a difference of 0.23%), and Immigrants from Malaysia (15.0%, a difference of 0.24%).
| Demographics | Rating | Rank | Child Poverty Among Girls Under 16 |
| Immigrants | Belarus | 97.0 /100 | #91 | Exceptional 14.8% |
| Austrians | 96.7 /100 | #92 | Exceptional 14.9% |
| Immigrants | North America | 96.6 /100 | #93 | Exceptional 14.9% |
| Immigrants | Switzerland | 96.3 /100 | #94 | Exceptional 14.9% |
| Germans | 96.3 /100 | #95 | Exceptional 14.9% |
| Immigrants | France | 96.2 /100 | #96 | Exceptional 14.9% |
| Immigrants | Latvia | 96.1 /100 | #97 | Exceptional 14.9% |
| Basques | 95.9 /100 | #98 | Exceptional 15.0% |
| Immigrants | Egypt | 95.7 /100 | #99 | Exceptional 15.0% |
| Paraguayans | 95.7 /100 | #100 | Exceptional 15.0% |
| Immigrants | South Africa | 95.6 /100 | #101 | Exceptional 15.0% |
| Immigrants | Malaysia | 95.6 /100 | #102 | Exceptional 15.0% |
| British | 95.6 /100 | #103 | Exceptional 15.0% |
| Romanians | 95.3 /100 | #104 | Exceptional 15.0% |
| Immigrants | England | 95.1 /100 | #105 | Exceptional 15.1% |