Immigrants from Eastern Africa vs Basque Male Poverty
COMPARE
Immigrants from Eastern Africa
Basque
Male Poverty
Male Poverty Comparison
Immigrants from Eastern Africa
Basques
12.0%
MALE POVERTY
5.4/ 100
METRIC RATING
206th/ 347
METRIC RANK
10.9%
MALE POVERTY
74.6/ 100
METRIC RATING
142nd/ 347
METRIC RANK
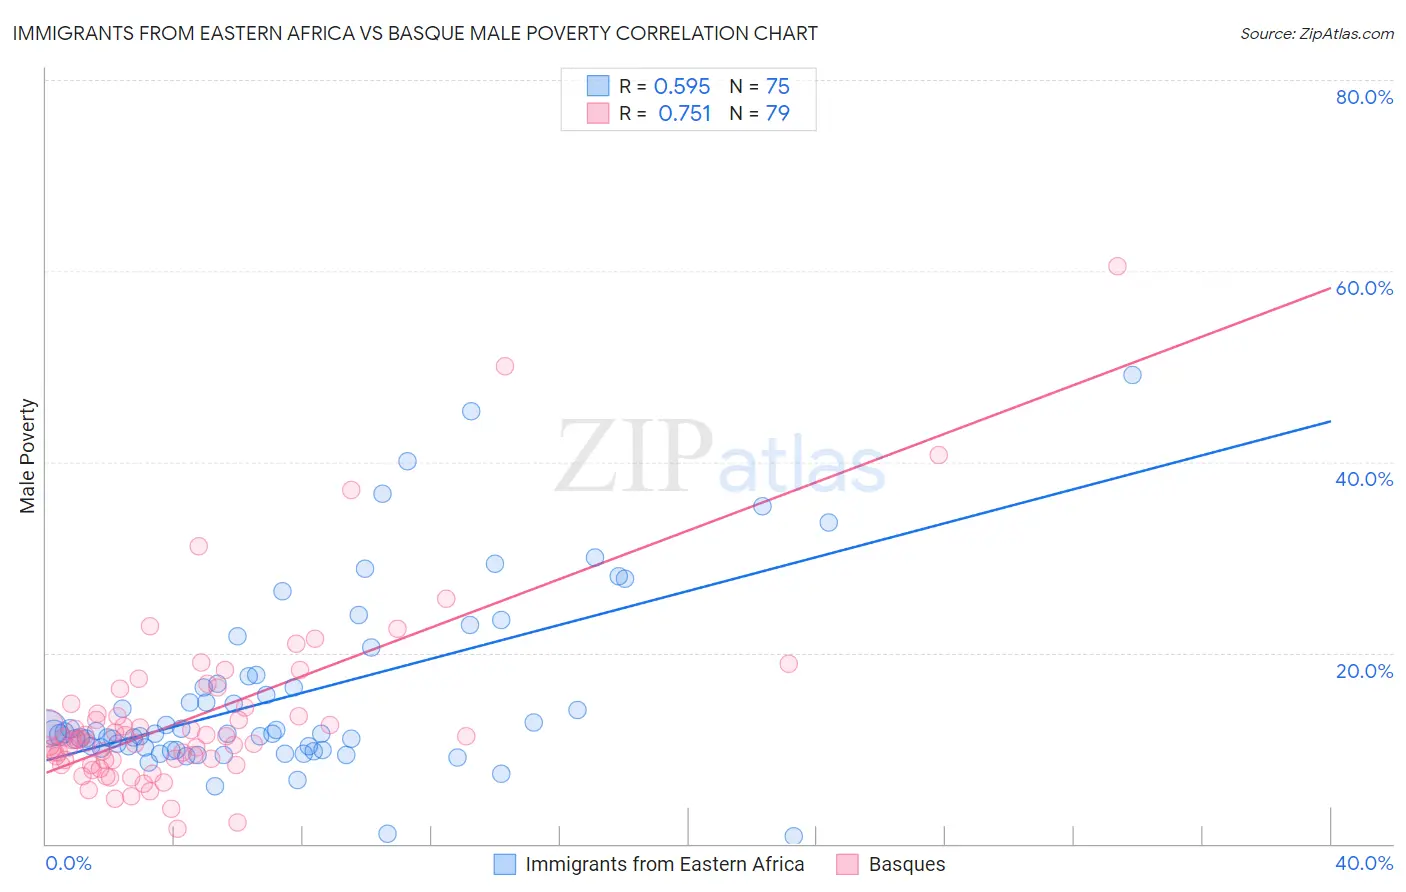
Immigrants from Eastern Africa vs Basque Male Poverty Correlation Chart
The statistical analysis conducted on geographies consisting of 354,832,028 people shows a substantial positive correlation between the proportion of Immigrants from Eastern Africa and poverty level among males in the United States with a correlation coefficient (R) of 0.595 and weighted average of 12.0%. Similarly, the statistical analysis conducted on geographies consisting of 165,709,169 people shows a strong positive correlation between the proportion of Basques and poverty level among males in the United States with a correlation coefficient (R) of 0.751 and weighted average of 10.9%, a difference of 9.9%.
Male Poverty Correlation Summary
| Measurement | Immigrants from Eastern Africa | Basque |
| Minimum | 0.81% | 1.5% |
| Maximum | 49.1% | 60.5% |
| Range | 48.3% | 59.0% |
| Mean | 15.6% | 13.3% |
| Median | 11.5% | 10.9% |
| Interquartile 25% (IQ1) | 10.0% | 8.7% |
| Interquartile 75% (IQ3) | 17.5% | 14.3% |
| Interquartile Range (IQR) | 7.5% | 5.6% |
| Standard Deviation (Sample) | 9.5% | 9.6% |
| Standard Deviation (Population) | 9.5% | 9.5% |
Similar Demographics by Male Poverty
Demographics Similar to Immigrants from Eastern Africa by Male Poverty
In terms of male poverty, the demographic groups most similar to Immigrants from Eastern Africa are Malaysian (12.0%, a difference of 0.10%), Panamanian (11.9%, a difference of 0.35%), Immigrants (12.0%, a difference of 0.43%), Immigrants from the Azores (12.0%, a difference of 0.54%), and Moroccan (12.0%, a difference of 0.60%).
| Demographics | Rating | Rank | Male Poverty |
| Spanish | 14.1 /100 | #199 | Poor 11.7% |
| Immigrants | Lebanon | 13.6 /100 | #200 | Poor 11.7% |
| Spaniards | 13.5 /100 | #201 | Poor 11.7% |
| Aleuts | 10.4 /100 | #202 | Poor 11.8% |
| Immigrants | Western Asia | 9.8 /100 | #203 | Tragic 11.8% |
| Immigrants | Uganda | 8.5 /100 | #204 | Tragic 11.8% |
| Panamanians | 6.2 /100 | #205 | Tragic 11.9% |
| Immigrants | Eastern Africa | 5.4 /100 | #206 | Tragic 12.0% |
| Malaysians | 5.2 /100 | #207 | Tragic 12.0% |
| Immigrants | Immigrants | 4.5 /100 | #208 | Tragic 12.0% |
| Immigrants | Azores | 4.3 /100 | #209 | Tragic 12.0% |
| Moroccans | 4.2 /100 | #210 | Tragic 12.0% |
| Immigrants | Panama | 4.0 /100 | #211 | Tragic 12.1% |
| Americans | 3.2 /100 | #212 | Tragic 12.1% |
| Immigrants | Nonimmigrants | 3.1 /100 | #213 | Tragic 12.1% |
Demographics Similar to Basques by Male Poverty
In terms of male poverty, the demographic groups most similar to Basques are Immigrants from France (10.9%, a difference of 0.17%), Tlingit-Haida (10.9%, a difference of 0.20%), Afghan (10.9%, a difference of 0.34%), Samoan (10.9%, a difference of 0.36%), and Immigrants from Germany (10.9%, a difference of 0.38%).
| Demographics | Rating | Rank | Male Poverty |
| Brazilians | 82.7 /100 | #135 | Excellent 10.8% |
| Immigrants | Israel | 80.9 /100 | #136 | Excellent 10.8% |
| Immigrants | Switzerland | 79.2 /100 | #137 | Good 10.8% |
| Yugoslavians | 78.2 /100 | #138 | Good 10.8% |
| Immigrants | Jordan | 77.5 /100 | #139 | Good 10.8% |
| Tlingit-Haida | 76.1 /100 | #140 | Good 10.9% |
| Immigrants | France | 75.8 /100 | #141 | Good 10.9% |
| Basques | 74.6 /100 | #142 | Good 10.9% |
| Afghans | 71.9 /100 | #143 | Good 10.9% |
| Samoans | 71.8 /100 | #144 | Good 10.9% |
| Immigrants | Germany | 71.6 /100 | #145 | Good 10.9% |
| Syrians | 71.4 /100 | #146 | Good 10.9% |
| Icelanders | 68.5 /100 | #147 | Good 11.0% |
| Armenians | 68.0 /100 | #148 | Good 11.0% |
| Immigrants | Venezuela | 67.9 /100 | #149 | Good 11.0% |