South American Indian vs Cuban Male Disability
COMPARE
South American Indian
Cuban
Male Disability
Male Disability Comparison
South American Indians
Cubans
10.9%
MALE DISABILITY
88.1/ 100
METRIC RATING
124th/ 347
METRIC RANK
11.0%
MALE DISABILITY
74.9/ 100
METRIC RATING
151st/ 347
METRIC RANK
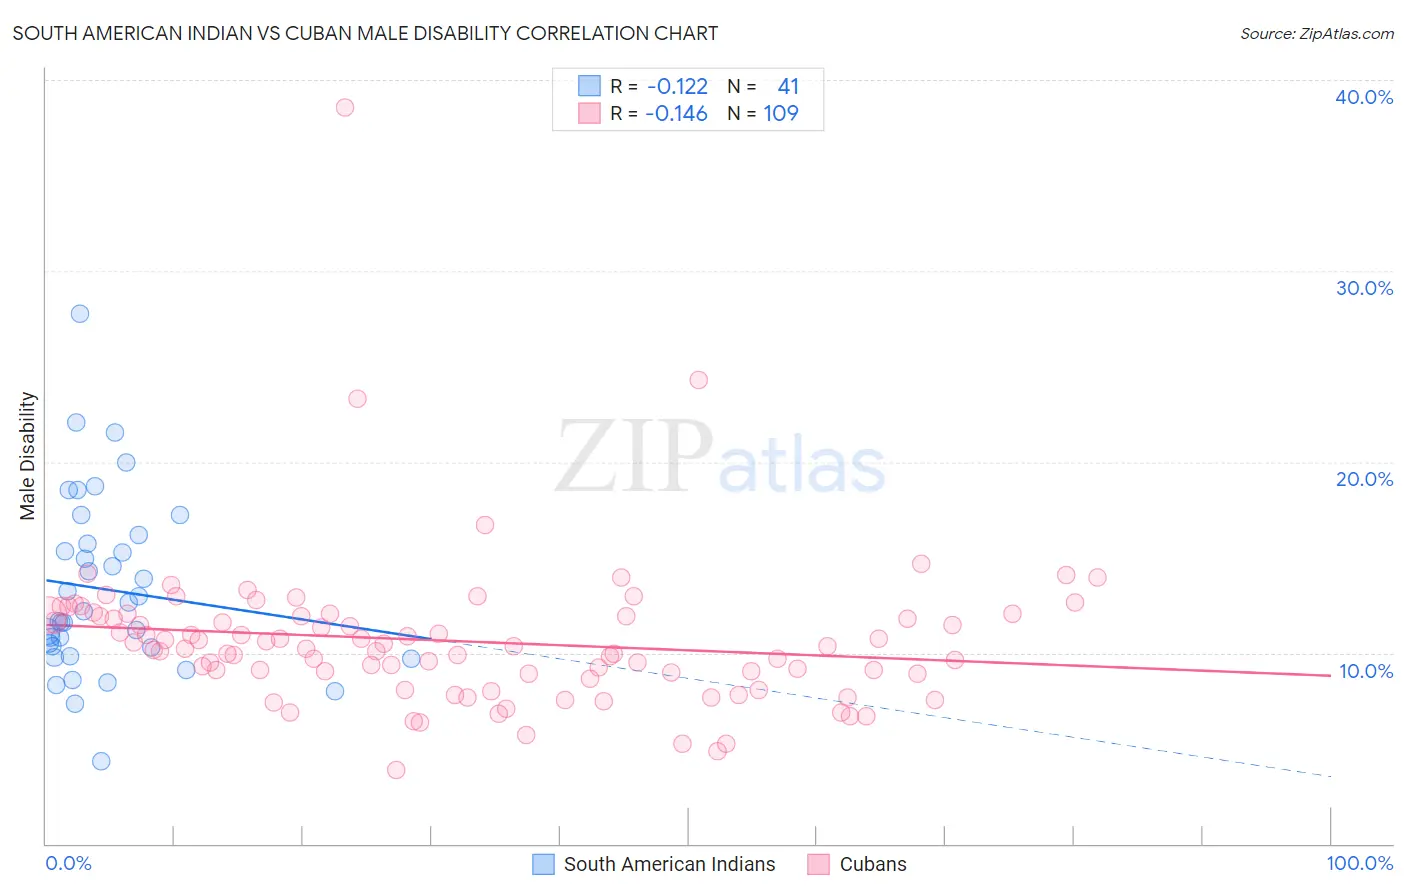
South American Indian vs Cuban Male Disability Correlation Chart
The statistical analysis conducted on geographies consisting of 164,560,942 people shows a poor negative correlation between the proportion of South American Indians and percentage of males with a disability in the United States with a correlation coefficient (R) of -0.122 and weighted average of 10.9%. Similarly, the statistical analysis conducted on geographies consisting of 449,227,297 people shows a poor negative correlation between the proportion of Cubans and percentage of males with a disability in the United States with a correlation coefficient (R) of -0.146 and weighted average of 11.0%, a difference of 1.3%.
Male Disability Correlation Summary
| Measurement | South American Indian | Cuban |
| Minimum | 4.3% | 3.9% |
| Maximum | 27.7% | 38.6% |
| Range | 23.4% | 34.7% |
| Mean | 13.3% | 10.6% |
| Median | 12.2% | 10.2% |
| Interquartile 25% (IQ1) | 10.1% | 8.9% |
| Interquartile 75% (IQ3) | 15.9% | 11.9% |
| Interquartile Range (IQR) | 5.9% | 3.0% |
| Standard Deviation (Sample) | 4.7% | 4.0% |
| Standard Deviation (Population) | 4.6% | 4.0% |
Similar Demographics by Male Disability
Demographics Similar to South American Indians by Male Disability
In terms of male disability, the demographic groups most similar to South American Indians are Immigrants from North Macedonia (10.9%, a difference of 0.0%), Immigrants from Czechoslovakia (10.9%, a difference of 0.040%), Immigrants from Ghana (10.9%, a difference of 0.14%), Immigrants from South Eastern Asia (10.9%, a difference of 0.15%), and Immigrants from Trinidad and Tobago (10.9%, a difference of 0.16%).
| Demographics | Rating | Rank | Male Disability |
| Eastern Europeans | 90.6 /100 | #117 | Exceptional 10.9% |
| Immigrants | Cuba | 90.2 /100 | #118 | Exceptional 10.9% |
| Armenians | 90.1 /100 | #119 | Exceptional 10.9% |
| Immigrants | Africa | 89.4 /100 | #120 | Excellent 10.9% |
| Immigrants | South Eastern Asia | 89.2 /100 | #121 | Excellent 10.9% |
| Immigrants | Ghana | 89.0 /100 | #122 | Excellent 10.9% |
| Immigrants | Czechoslovakia | 88.4 /100 | #123 | Excellent 10.9% |
| South American Indians | 88.1 /100 | #124 | Excellent 10.9% |
| Immigrants | North Macedonia | 88.1 /100 | #125 | Excellent 10.9% |
| Immigrants | Trinidad and Tobago | 86.9 /100 | #126 | Excellent 10.9% |
| Immigrants | Ukraine | 86.8 /100 | #127 | Excellent 10.9% |
| Immigrants | Latvia | 85.5 /100 | #128 | Excellent 10.9% |
| Immigrants | Philippines | 85.4 /100 | #129 | Excellent 10.9% |
| Brazilians | 85.4 /100 | #130 | Excellent 10.9% |
| Macedonians | 84.2 /100 | #131 | Excellent 11.0% |
Demographics Similar to Cubans by Male Disability
In terms of male disability, the demographic groups most similar to Cubans are Immigrants from Guatemala (11.0%, a difference of 0.020%), Immigrants from Albania (11.0%, a difference of 0.030%), Immigrants from Denmark (11.0%, a difference of 0.12%), Immigrants from Northern Europe (11.1%, a difference of 0.12%), and Immigrants from Moldova (11.1%, a difference of 0.15%).
| Demographics | Rating | Rank | Male Disability |
| Kenyans | 78.1 /100 | #144 | Good 11.0% |
| Costa Ricans | 78.0 /100 | #145 | Good 11.0% |
| Koreans | 77.5 /100 | #146 | Good 11.0% |
| Immigrants | Croatia | 77.3 /100 | #147 | Good 11.0% |
| Sudanese | 77.1 /100 | #148 | Good 11.0% |
| Immigrants | Denmark | 76.4 /100 | #149 | Good 11.0% |
| Immigrants | Guatemala | 75.1 /100 | #150 | Good 11.0% |
| Cubans | 74.9 /100 | #151 | Good 11.0% |
| Immigrants | Albania | 74.4 /100 | #152 | Good 11.0% |
| Immigrants | Northern Europe | 73.2 /100 | #153 | Good 11.1% |
| Immigrants | Moldova | 72.8 /100 | #154 | Good 11.1% |
| Immigrants | Middle Africa | 70.9 /100 | #155 | Good 11.1% |
| Russians | 69.8 /100 | #156 | Good 11.1% |
| Immigrants | Western Africa | 69.2 /100 | #157 | Good 11.1% |
| Latvians | 68.1 /100 | #158 | Good 11.1% |