Slovak vs Immigrants from Zaire Female Poverty
COMPARE
Slovak
Immigrants from Zaire
Female Poverty
Female Poverty Comparison
Slovaks
Immigrants from Zaire
12.3%
FEMALE POVERTY
97.1/ 100
METRIC RATING
80th/ 347
METRIC RANK
16.4%
FEMALE POVERTY
0.0/ 100
METRIC RATING
292nd/ 347
METRIC RANK
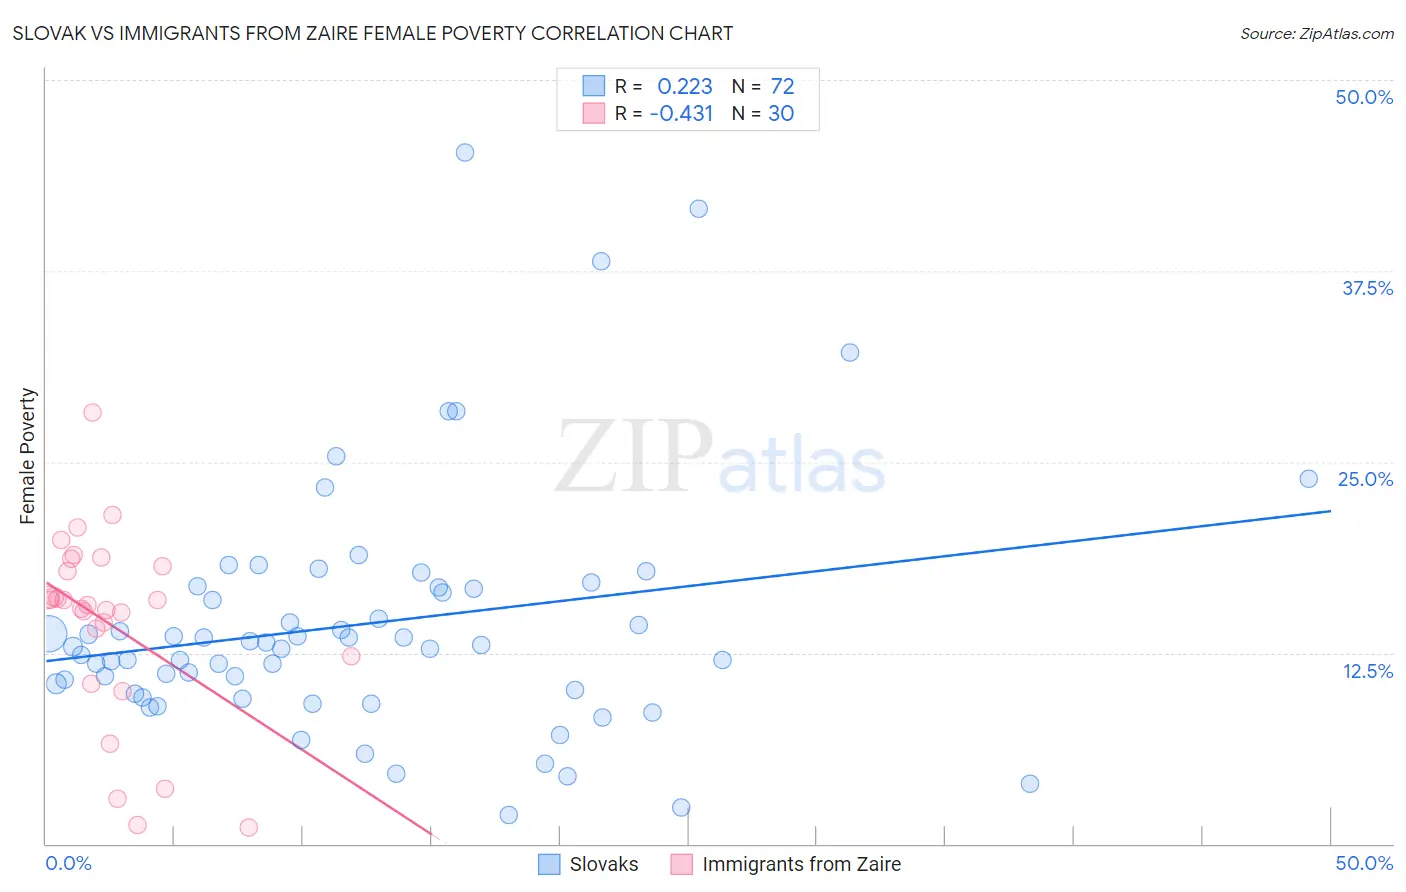
Slovak vs Immigrants from Zaire Female Poverty Correlation Chart
The statistical analysis conducted on geographies consisting of 397,576,830 people shows a weak positive correlation between the proportion of Slovaks and poverty level among females in the United States with a correlation coefficient (R) of 0.223 and weighted average of 12.3%. Similarly, the statistical analysis conducted on geographies consisting of 107,241,785 people shows a moderate negative correlation between the proportion of Immigrants from Zaire and poverty level among females in the United States with a correlation coefficient (R) of -0.431 and weighted average of 16.4%, a difference of 33.4%.
Female Poverty Correlation Summary
| Measurement | Slovak | Immigrants from Zaire |
| Minimum | 1.9% | 1.0% |
| Maximum | 45.3% | 28.2% |
| Range | 43.4% | 27.2% |
| Mean | 14.4% | 14.4% |
| Median | 12.9% | 15.8% |
| Interquartile 25% (IQ1) | 9.9% | 12.3% |
| Interquartile 75% (IQ3) | 16.7% | 18.2% |
| Interquartile Range (IQR) | 6.8% | 5.9% |
| Standard Deviation (Sample) | 8.1% | 6.2% |
| Standard Deviation (Population) | 8.0% | 6.1% |
Similar Demographics by Female Poverty
Demographics Similar to Slovaks by Female Poverty
In terms of female poverty, the demographic groups most similar to Slovaks are Immigrants from Sweden (12.3%, a difference of 0.0%), Jordanian (12.3%, a difference of 0.010%), Immigrants from North America (12.3%, a difference of 0.050%), Egyptian (12.3%, a difference of 0.12%), and Serbian (12.3%, a difference of 0.13%).
| Demographics | Rating | Rank | Female Poverty |
| Zimbabweans | 97.5 /100 | #73 | Exceptional 12.3% |
| Immigrants | Canada | 97.5 /100 | #74 | Exceptional 12.3% |
| Europeans | 97.4 /100 | #75 | Exceptional 12.3% |
| Immigrants | Eastern Europe | 97.2 /100 | #76 | Exceptional 12.3% |
| Serbians | 97.2 /100 | #77 | Exceptional 12.3% |
| Egyptians | 97.2 /100 | #78 | Exceptional 12.3% |
| Immigrants | North America | 97.1 /100 | #79 | Exceptional 12.3% |
| Slovaks | 97.1 /100 | #80 | Exceptional 12.3% |
| Immigrants | Sweden | 97.1 /100 | #81 | Exceptional 12.3% |
| Jordanians | 97.1 /100 | #82 | Exceptional 12.3% |
| Immigrants | England | 96.9 /100 | #83 | Exceptional 12.3% |
| Northern Europeans | 96.6 /100 | #84 | Exceptional 12.4% |
| Irish | 96.5 /100 | #85 | Exceptional 12.4% |
| Dutch | 96.5 /100 | #86 | Exceptional 12.4% |
| Okinawans | 96.4 /100 | #87 | Exceptional 12.4% |
Demographics Similar to Immigrants from Zaire by Female Poverty
In terms of female poverty, the demographic groups most similar to Immigrants from Zaire are Yaqui (16.4%, a difference of 0.010%), Immigrants from Latin America (16.4%, a difference of 0.060%), Immigrants from Cabo Verde (16.4%, a difference of 0.090%), Senegalese (16.5%, a difference of 0.17%), and Immigrants from Bangladesh (16.4%, a difference of 0.18%).
| Demographics | Rating | Rank | Female Poverty |
| Comanche | 0.0 /100 | #285 | Tragic 16.2% |
| Inupiat | 0.0 /100 | #286 | Tragic 16.2% |
| Immigrants | Belize | 0.0 /100 | #287 | Tragic 16.3% |
| Indonesians | 0.0 /100 | #288 | Tragic 16.4% |
| Blackfeet | 0.0 /100 | #289 | Tragic 16.4% |
| Immigrants | Bangladesh | 0.0 /100 | #290 | Tragic 16.4% |
| Yaqui | 0.0 /100 | #291 | Tragic 16.4% |
| Immigrants | Zaire | 0.0 /100 | #292 | Tragic 16.4% |
| Immigrants | Latin America | 0.0 /100 | #293 | Tragic 16.4% |
| Immigrants | Cabo Verde | 0.0 /100 | #294 | Tragic 16.4% |
| Senegalese | 0.0 /100 | #295 | Tragic 16.5% |
| Immigrants | Senegal | 0.0 /100 | #296 | Tragic 16.5% |
| Mexicans | 0.0 /100 | #297 | Tragic 16.5% |
| Somalis | 0.0 /100 | #298 | Tragic 16.6% |
| Hispanics or Latinos | 0.0 /100 | #299 | Tragic 16.6% |