Slovak vs Central American Female Poverty
COMPARE
Slovak
Central American
Female Poverty
Female Poverty Comparison
Slovaks
Central Americans
12.3%
FEMALE POVERTY
97.1/ 100
METRIC RATING
80th/ 347
METRIC RANK
16.0%
FEMALE POVERTY
0.0/ 100
METRIC RATING
276th/ 347
METRIC RANK
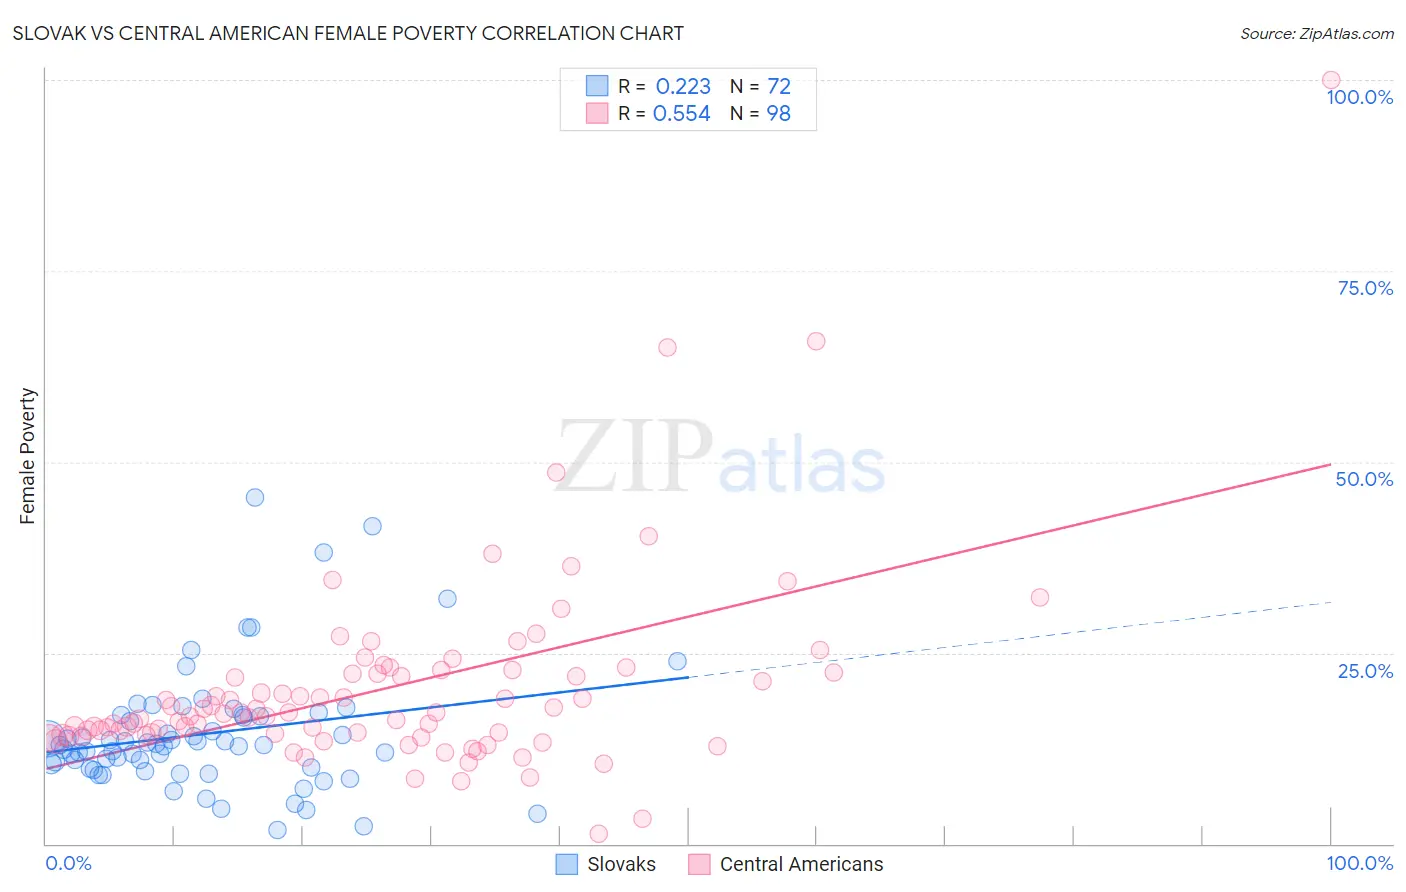
Slovak vs Central American Female Poverty Correlation Chart
The statistical analysis conducted on geographies consisting of 397,576,830 people shows a weak positive correlation between the proportion of Slovaks and poverty level among females in the United States with a correlation coefficient (R) of 0.223 and weighted average of 12.3%. Similarly, the statistical analysis conducted on geographies consisting of 503,924,730 people shows a substantial positive correlation between the proportion of Central Americans and poverty level among females in the United States with a correlation coefficient (R) of 0.554 and weighted average of 16.0%, a difference of 29.8%.
Female Poverty Correlation Summary
| Measurement | Slovak | Central American |
| Minimum | 1.9% | 1.3% |
| Maximum | 45.3% | 100.0% |
| Range | 43.4% | 98.8% |
| Mean | 14.4% | 20.2% |
| Median | 12.9% | 16.9% |
| Interquartile 25% (IQ1) | 9.9% | 14.3% |
| Interquartile 75% (IQ3) | 16.7% | 22.2% |
| Interquartile Range (IQR) | 6.8% | 7.9% |
| Standard Deviation (Sample) | 8.1% | 12.8% |
| Standard Deviation (Population) | 8.0% | 12.8% |
Similar Demographics by Female Poverty
Demographics Similar to Slovaks by Female Poverty
In terms of female poverty, the demographic groups most similar to Slovaks are Immigrants from Sweden (12.3%, a difference of 0.0%), Jordanian (12.3%, a difference of 0.010%), Immigrants from North America (12.3%, a difference of 0.050%), Egyptian (12.3%, a difference of 0.12%), and Serbian (12.3%, a difference of 0.13%).
| Demographics | Rating | Rank | Female Poverty |
| Zimbabweans | 97.5 /100 | #73 | Exceptional 12.3% |
| Immigrants | Canada | 97.5 /100 | #74 | Exceptional 12.3% |
| Europeans | 97.4 /100 | #75 | Exceptional 12.3% |
| Immigrants | Eastern Europe | 97.2 /100 | #76 | Exceptional 12.3% |
| Serbians | 97.2 /100 | #77 | Exceptional 12.3% |
| Egyptians | 97.2 /100 | #78 | Exceptional 12.3% |
| Immigrants | North America | 97.1 /100 | #79 | Exceptional 12.3% |
| Slovaks | 97.1 /100 | #80 | Exceptional 12.3% |
| Immigrants | Sweden | 97.1 /100 | #81 | Exceptional 12.3% |
| Jordanians | 97.1 /100 | #82 | Exceptional 12.3% |
| Immigrants | England | 96.9 /100 | #83 | Exceptional 12.3% |
| Northern Europeans | 96.6 /100 | #84 | Exceptional 12.4% |
| Irish | 96.5 /100 | #85 | Exceptional 12.4% |
| Dutch | 96.5 /100 | #86 | Exceptional 12.4% |
| Okinawans | 96.4 /100 | #87 | Exceptional 12.4% |
Demographics Similar to Central Americans by Female Poverty
In terms of female poverty, the demographic groups most similar to Central Americans are Immigrants from Barbados (16.0%, a difference of 0.13%), Barbadian (15.9%, a difference of 0.19%), Bangladeshi (16.0%, a difference of 0.19%), Belizean (15.9%, a difference of 0.20%), and Haitian (15.9%, a difference of 0.20%).
| Demographics | Rating | Rank | Female Poverty |
| Iroquois | 0.1 /100 | #269 | Tragic 15.8% |
| Chickasaw | 0.1 /100 | #270 | Tragic 15.9% |
| Immigrants | St. Vincent and the Grenadines | 0.0 /100 | #271 | Tragic 15.9% |
| Belizeans | 0.0 /100 | #272 | Tragic 15.9% |
| Haitians | 0.0 /100 | #273 | Tragic 15.9% |
| Barbadians | 0.0 /100 | #274 | Tragic 15.9% |
| Immigrants | Barbados | 0.0 /100 | #275 | Tragic 16.0% |
| Central Americans | 0.0 /100 | #276 | Tragic 16.0% |
| Bangladeshis | 0.0 /100 | #277 | Tragic 16.0% |
| Immigrants | West Indies | 0.0 /100 | #278 | Tragic 16.1% |
| Immigrants | Bahamas | 0.0 /100 | #279 | Tragic 16.1% |
| Vietnamese | 0.0 /100 | #280 | Tragic 16.1% |
| West Indians | 0.0 /100 | #281 | Tragic 16.1% |
| Immigrants | Haiti | 0.0 /100 | #282 | Tragic 16.1% |
| Immigrants | Cuba | 0.0 /100 | #283 | Tragic 16.1% |