Slovak vs American Female Poverty
COMPARE
Slovak
American
Female Poverty
Female Poverty Comparison
Slovaks
Americans
12.3%
FEMALE POVERTY
97.1/ 100
METRIC RATING
80th/ 347
METRIC RANK
14.6%
FEMALE POVERTY
2.8/ 100
METRIC RATING
224th/ 347
METRIC RANK
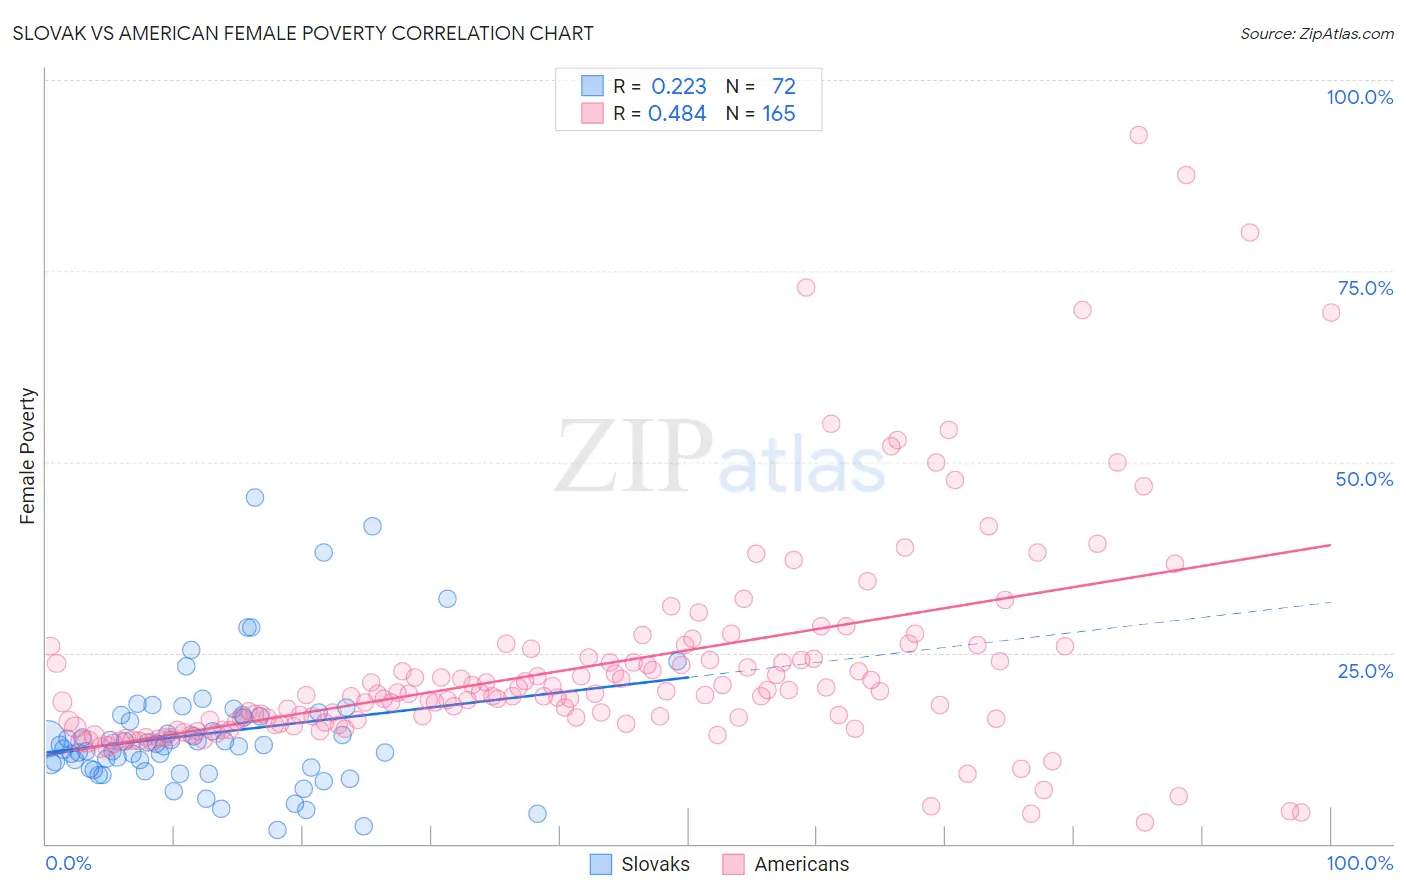
Slovak vs American Female Poverty Correlation Chart
The statistical analysis conducted on geographies consisting of 397,576,830 people shows a weak positive correlation between the proportion of Slovaks and poverty level among females in the United States with a correlation coefficient (R) of 0.223 and weighted average of 12.3%. Similarly, the statistical analysis conducted on geographies consisting of 580,452,032 people shows a moderate positive correlation between the proportion of Americans and poverty level among females in the United States with a correlation coefficient (R) of 0.484 and weighted average of 14.6%, a difference of 18.5%.
Female Poverty Correlation Summary
| Measurement | Slovak | American |
| Minimum | 1.9% | 2.7% |
| Maximum | 45.3% | 92.7% |
| Range | 43.4% | 90.0% |
| Mean | 14.4% | 23.2% |
| Median | 12.9% | 19.4% |
| Interquartile 25% (IQ1) | 9.9% | 15.6% |
| Interquartile 75% (IQ3) | 16.7% | 24.2% |
| Interquartile Range (IQR) | 6.8% | 8.5% |
| Standard Deviation (Sample) | 8.1% | 14.5% |
| Standard Deviation (Population) | 8.0% | 14.5% |
Similar Demographics by Female Poverty
Demographics Similar to Slovaks by Female Poverty
In terms of female poverty, the demographic groups most similar to Slovaks are Immigrants from Sweden (12.3%, a difference of 0.0%), Jordanian (12.3%, a difference of 0.010%), Immigrants from North America (12.3%, a difference of 0.050%), Egyptian (12.3%, a difference of 0.12%), and Serbian (12.3%, a difference of 0.13%).
| Demographics | Rating | Rank | Female Poverty |
| Zimbabweans | 97.5 /100 | #73 | Exceptional 12.3% |
| Immigrants | Canada | 97.5 /100 | #74 | Exceptional 12.3% |
| Europeans | 97.4 /100 | #75 | Exceptional 12.3% |
| Immigrants | Eastern Europe | 97.2 /100 | #76 | Exceptional 12.3% |
| Serbians | 97.2 /100 | #77 | Exceptional 12.3% |
| Egyptians | 97.2 /100 | #78 | Exceptional 12.3% |
| Immigrants | North America | 97.1 /100 | #79 | Exceptional 12.3% |
| Slovaks | 97.1 /100 | #80 | Exceptional 12.3% |
| Immigrants | Sweden | 97.1 /100 | #81 | Exceptional 12.3% |
| Jordanians | 97.1 /100 | #82 | Exceptional 12.3% |
| Immigrants | England | 96.9 /100 | #83 | Exceptional 12.3% |
| Northern Europeans | 96.6 /100 | #84 | Exceptional 12.4% |
| Irish | 96.5 /100 | #85 | Exceptional 12.4% |
| Dutch | 96.5 /100 | #86 | Exceptional 12.4% |
| Okinawans | 96.4 /100 | #87 | Exceptional 12.4% |
Demographics Similar to Americans by Female Poverty
In terms of female poverty, the demographic groups most similar to Americans are Immigrants from Micronesia (14.6%, a difference of 0.0%), Immigrants from Eritrea (14.6%, a difference of 0.33%), Immigrants from Africa (14.5%, a difference of 0.39%), Nonimmigrants (14.5%, a difference of 0.63%), and Immigrants from Nigeria (14.7%, a difference of 0.64%).
| Demographics | Rating | Rank | Female Poverty |
| Immigrants | Immigrants | 4.5 /100 | #217 | Tragic 14.4% |
| Immigrants | Uzbekistan | 4.4 /100 | #218 | Tragic 14.4% |
| Japanese | 4.1 /100 | #219 | Tragic 14.5% |
| Alsatians | 4.0 /100 | #220 | Tragic 14.5% |
| Immigrants | Cambodia | 3.7 /100 | #221 | Tragic 14.5% |
| Immigrants | Nonimmigrants | 3.7 /100 | #222 | Tragic 14.5% |
| Immigrants | Africa | 3.3 /100 | #223 | Tragic 14.5% |
| Americans | 2.8 /100 | #224 | Tragic 14.6% |
| Immigrants | Micronesia | 2.8 /100 | #225 | Tragic 14.6% |
| Immigrants | Eritrea | 2.4 /100 | #226 | Tragic 14.6% |
| Immigrants | Nigeria | 2.1 /100 | #227 | Tragic 14.7% |
| German Russians | 2.0 /100 | #228 | Tragic 14.7% |
| Ghanaians | 1.9 /100 | #229 | Tragic 14.7% |
| Alaska Natives | 1.8 /100 | #230 | Tragic 14.7% |
| Nigerians | 1.7 /100 | #231 | Tragic 14.8% |