Slovak vs Chilean Single Female Poverty
COMPARE
Slovak
Chilean
Single Female Poverty
Single Female Poverty Comparison
Slovaks
Chileans
21.1%
SINGLE FEMALE POVERTY
39.7/ 100
METRIC RATING
183rd/ 347
METRIC RANK
19.9%
SINGLE FEMALE POVERTY
96.9/ 100
METRIC RATING
104th/ 347
METRIC RANK
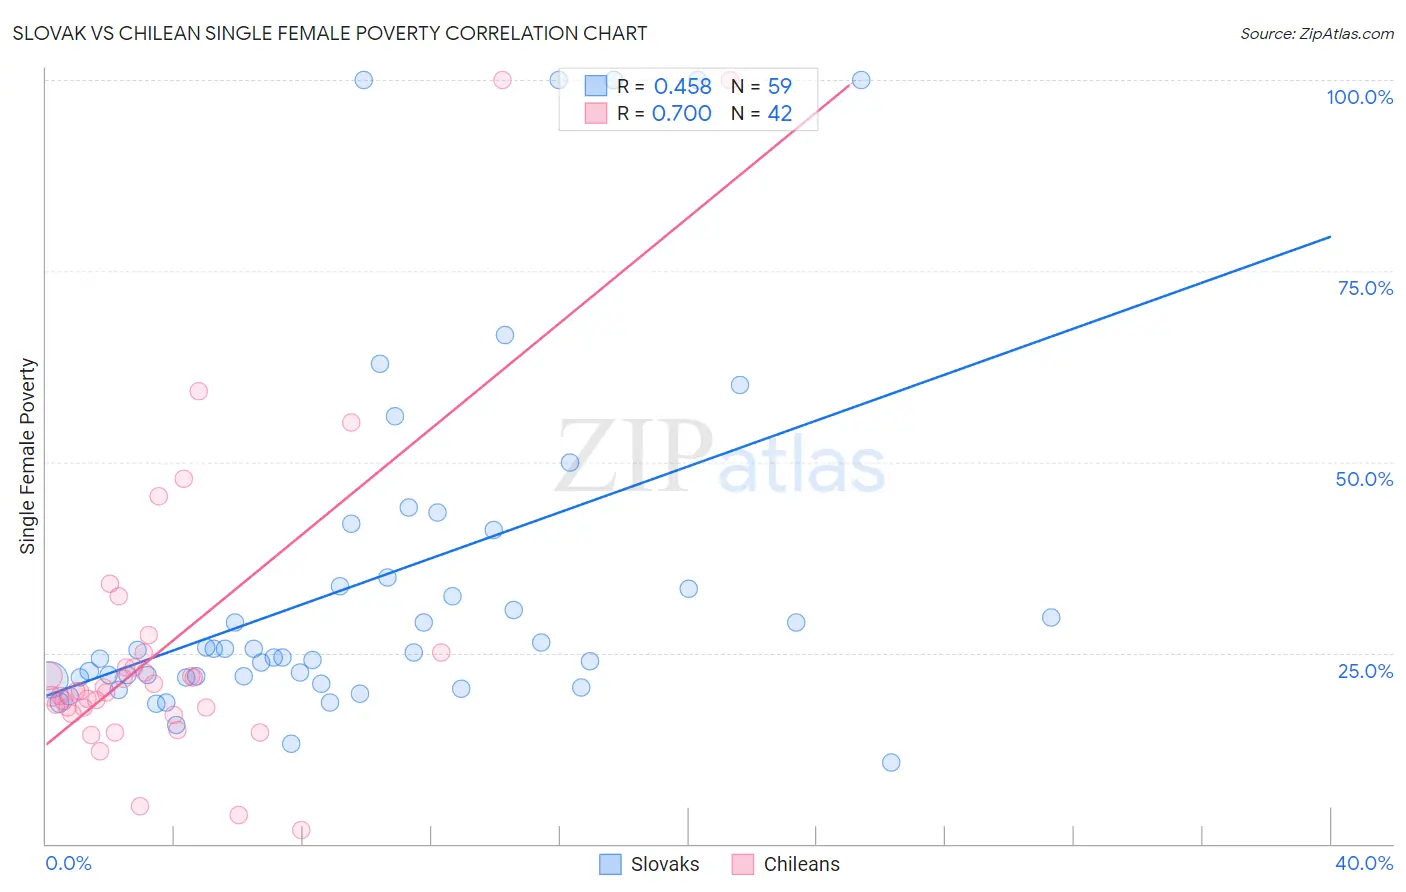
Slovak vs Chilean Single Female Poverty Correlation Chart
The statistical analysis conducted on geographies consisting of 389,214,843 people shows a moderate positive correlation between the proportion of Slovaks and poverty level among single females in the United States with a correlation coefficient (R) of 0.458 and weighted average of 21.1%. Similarly, the statistical analysis conducted on geographies consisting of 254,415,237 people shows a strong positive correlation between the proportion of Chileans and poverty level among single females in the United States with a correlation coefficient (R) of 0.700 and weighted average of 19.9%, a difference of 6.3%.
Single Female Poverty Correlation Summary
| Measurement | Slovak | Chilean |
| Minimum | 10.7% | 1.8% |
| Maximum | 100.0% | 100.0% |
| Range | 89.3% | 98.2% |
| Mean | 34.3% | 25.9% |
| Median | 25.1% | 19.9% |
| Interquartile 25% (IQ1) | 21.8% | 17.8% |
| Interquartile 75% (IQ3) | 34.8% | 25.0% |
| Interquartile Range (IQR) | 13.0% | 7.2% |
| Standard Deviation (Sample) | 23.3% | 20.4% |
| Standard Deviation (Population) | 23.1% | 20.1% |
Similar Demographics by Single Female Poverty
Demographics Similar to Slovaks by Single Female Poverty
In terms of single female poverty, the demographic groups most similar to Slovaks are Hungarian (21.1%, a difference of 0.010%), Slavic (21.1%, a difference of 0.050%), Immigrants from Cambodia (21.2%, a difference of 0.10%), Hawaiian (21.2%, a difference of 0.14%), and Spanish American Indian (21.1%, a difference of 0.17%).
| Demographics | Rating | Rank | Single Female Poverty |
| Canadians | 45.4 /100 | #176 | Average 21.1% |
| Scandinavians | 45.2 /100 | #177 | Average 21.1% |
| Immigrants | Bosnia and Herzegovina | 44.9 /100 | #178 | Average 21.1% |
| British | 42.9 /100 | #179 | Average 21.1% |
| Spanish American Indians | 42.5 /100 | #180 | Average 21.1% |
| Europeans | 42.3 /100 | #181 | Average 21.1% |
| Slavs | 40.5 /100 | #182 | Average 21.1% |
| Slovaks | 39.7 /100 | #183 | Fair 21.1% |
| Hungarians | 39.6 /100 | #184 | Fair 21.1% |
| Immigrants | Cambodia | 38.2 /100 | #185 | Fair 21.2% |
| Hawaiians | 37.7 /100 | #186 | Fair 21.2% |
| Immigrants | Nigeria | 36.8 /100 | #187 | Fair 21.2% |
| Yugoslavians | 35.4 /100 | #188 | Fair 21.2% |
| Immigrants | Cuba | 35.3 /100 | #189 | Fair 21.2% |
| Trinidadians and Tobagonians | 35.2 /100 | #190 | Fair 21.2% |
Demographics Similar to Chileans by Single Female Poverty
In terms of single female poverty, the demographic groups most similar to Chileans are Israeli (19.9%, a difference of 0.010%), Ethiopian (19.9%, a difference of 0.10%), Immigrants from Southern Europe (19.9%, a difference of 0.12%), Immigrants from Syria (19.9%, a difference of 0.12%), and Native Hawaiian (19.9%, a difference of 0.17%).
| Demographics | Rating | Rank | Single Female Poverty |
| Croatians | 98.1 /100 | #97 | Exceptional 19.7% |
| Immigrants | France | 97.9 /100 | #98 | Exceptional 19.7% |
| Sierra Leoneans | 97.9 /100 | #99 | Exceptional 19.7% |
| Ukrainians | 97.6 /100 | #100 | Exceptional 19.8% |
| Immigrants | Belgium | 97.3 /100 | #101 | Exceptional 19.8% |
| Immigrants | Cameroon | 97.3 /100 | #102 | Exceptional 19.8% |
| Immigrants | Southern Europe | 97.1 /100 | #103 | Exceptional 19.9% |
| Chileans | 96.9 /100 | #104 | Exceptional 19.9% |
| Israelis | 96.9 /100 | #105 | Exceptional 19.9% |
| Ethiopians | 96.7 /100 | #106 | Exceptional 19.9% |
| Immigrants | Syria | 96.7 /100 | #107 | Exceptional 19.9% |
| Native Hawaiians | 96.6 /100 | #108 | Exceptional 19.9% |
| Colombians | 96.6 /100 | #109 | Exceptional 19.9% |
| Immigrants | Western Asia | 96.5 /100 | #110 | Exceptional 19.9% |
| Carpatho Rusyns | 96.1 /100 | #111 | Exceptional 20.0% |