Slavic vs Puget Sound Salish In Labor Force | Age > 16
COMPARE
Slavic
Puget Sound Salish
In Labor Force | Age > 16
In Labor Force | Age > 16 Comparison
Slavs
Puget Sound Salish
64.6%
IN LABOR FORCE | AGE > 16
4.9/ 100
METRIC RATING
233rd/ 347
METRIC RANK
63.7%
IN LABOR FORCE | AGE > 16
0.0/ 100
METRIC RATING
294th/ 347
METRIC RANK
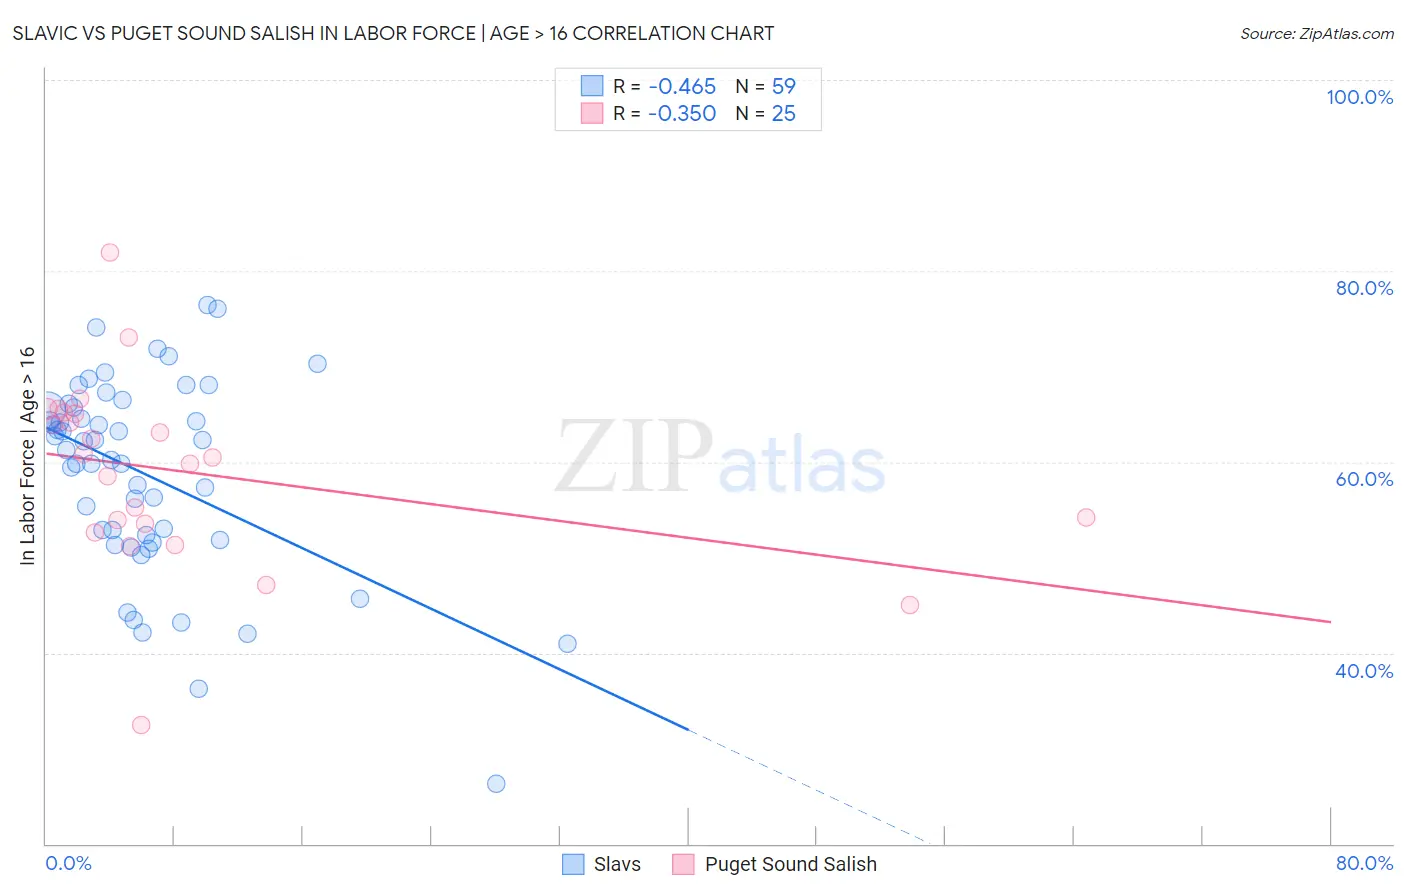
Slavic vs Puget Sound Salish In Labor Force | Age > 16 Correlation Chart
The statistical analysis conducted on geographies consisting of 270,879,770 people shows a moderate negative correlation between the proportion of Slavs and labor force participation rate among population ages 16 and over in the United States with a correlation coefficient (R) of -0.465 and weighted average of 64.6%. Similarly, the statistical analysis conducted on geographies consisting of 46,155,746 people shows a mild negative correlation between the proportion of Puget Sound Salish and labor force participation rate among population ages 16 and over in the United States with a correlation coefficient (R) of -0.350 and weighted average of 63.7%, a difference of 1.3%.
In Labor Force | Age > 16 Correlation Summary
| Measurement | Slavic | Puget Sound Salish |
| Minimum | 26.3% | 32.5% |
| Maximum | 76.4% | 81.9% |
| Range | 50.1% | 49.4% |
| Mean | 58.7% | 58.9% |
| Median | 61.2% | 60.4% |
| Interquartile 25% (IQ1) | 51.8% | 53.1% |
| Interquartile 75% (IQ3) | 65.8% | 65.1% |
| Interquartile Range (IQR) | 14.0% | 12.0% |
| Standard Deviation (Sample) | 10.3% | 9.8% |
| Standard Deviation (Population) | 10.2% | 9.6% |
Similar Demographics by In Labor Force | Age > 16
Demographics Similar to Slavs by In Labor Force | Age > 16
In terms of in labor force | age > 16, the demographic groups most similar to Slavs are Vietnamese (64.6%, a difference of 0.010%), Austrian (64.6%, a difference of 0.020%), Immigrants from Norway (64.6%, a difference of 0.020%), Italian (64.6%, a difference of 0.020%), and African (64.6%, a difference of 0.050%).
| Demographics | Rating | Rank | In Labor Force | Age > 16 |
| Europeans | 8.3 /100 | #226 | Tragic 64.7% |
| Poles | 8.3 /100 | #227 | Tragic 64.7% |
| Northern Europeans | 8.2 /100 | #228 | Tragic 64.7% |
| British | 7.3 /100 | #229 | Tragic 64.7% |
| Chinese | 7.3 /100 | #230 | Tragic 64.7% |
| Immigrants | Northern Europe | 7.2 /100 | #231 | Tragic 64.7% |
| Africans | 5.8 /100 | #232 | Tragic 64.6% |
| Slavs | 4.9 /100 | #233 | Tragic 64.6% |
| Vietnamese | 4.7 /100 | #234 | Tragic 64.6% |
| Austrians | 4.6 /100 | #235 | Tragic 64.6% |
| Immigrants | Norway | 4.6 /100 | #236 | Tragic 64.6% |
| Italians | 4.6 /100 | #237 | Tragic 64.6% |
| Lebanese | 3.9 /100 | #238 | Tragic 64.5% |
| Immigrants | Hungary | 3.8 /100 | #239 | Tragic 64.5% |
| Immigrants | Bangladesh | 3.6 /100 | #240 | Tragic 64.5% |
Demographics Similar to Puget Sound Salish by In Labor Force | Age > 16
In terms of in labor force | age > 16, the demographic groups most similar to Puget Sound Salish are English (63.7%, a difference of 0.030%), Immigrants from Canada (63.7%, a difference of 0.050%), Spanish American Indian (63.8%, a difference of 0.070%), Immigrants from North America (63.7%, a difference of 0.070%), and Nepalese (63.8%, a difference of 0.13%).
| Demographics | Rating | Rank | In Labor Force | Age > 16 |
| Scottish | 0.1 /100 | #287 | Tragic 63.9% |
| Spanish | 0.1 /100 | #288 | Tragic 63.9% |
| Celtics | 0.1 /100 | #289 | Tragic 63.8% |
| Hungarians | 0.1 /100 | #290 | Tragic 63.8% |
| Nepalese | 0.1 /100 | #291 | Tragic 63.8% |
| Spanish American Indians | 0.1 /100 | #292 | Tragic 63.8% |
| English | 0.1 /100 | #293 | Tragic 63.7% |
| Puget Sound Salish | 0.0 /100 | #294 | Tragic 63.7% |
| Immigrants | Canada | 0.0 /100 | #295 | Tragic 63.7% |
| Immigrants | North America | 0.0 /100 | #296 | Tragic 63.7% |
| Immigrants | Grenada | 0.0 /100 | #297 | Tragic 63.6% |
| Comanche | 0.0 /100 | #298 | Tragic 63.6% |
| Whites/Caucasians | 0.0 /100 | #299 | Tragic 63.6% |
| Immigrants | Azores | 0.0 /100 | #300 | Tragic 63.6% |
| Spanish Americans | 0.0 /100 | #301 | Tragic 63.6% |