Shoshone vs Ugandan Single Father Poverty
COMPARE
Shoshone
Ugandan
Single Father Poverty
Single Father Poverty Comparison
Shoshone
Ugandans
22.9%
SINGLE FATHER POVERTY
0.0/ 100
METRIC RATING
335th/ 347
METRIC RANK
16.3%
SINGLE FATHER POVERTY
55.9/ 100
METRIC RATING
162nd/ 347
METRIC RANK
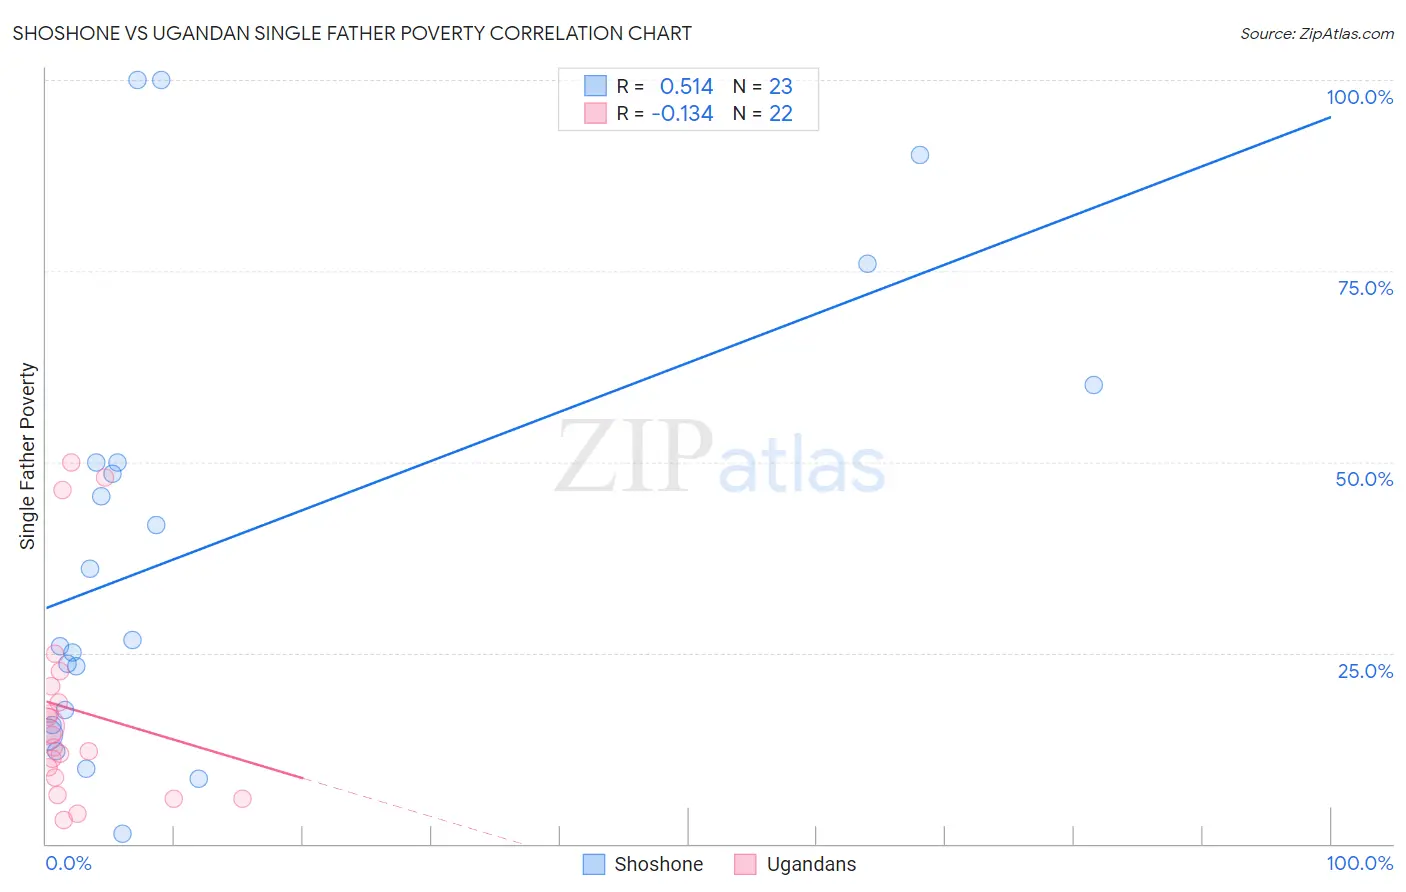
Shoshone vs Ugandan Single Father Poverty Correlation Chart
The statistical analysis conducted on geographies consisting of 62,234,172 people shows a substantial positive correlation between the proportion of Shoshone and poverty level among single fathers in the United States with a correlation coefficient (R) of 0.514 and weighted average of 22.9%. Similarly, the statistical analysis conducted on geographies consisting of 87,224,974 people shows a poor negative correlation between the proportion of Ugandans and poverty level among single fathers in the United States with a correlation coefficient (R) of -0.134 and weighted average of 16.3%, a difference of 41.0%.
Single Father Poverty Correlation Summary
| Measurement | Shoshone | Ugandan |
| Minimum | 1.4% | 3.2% |
| Maximum | 100.0% | 50.0% |
| Range | 98.6% | 46.8% |
| Mean | 39.2% | 17.5% |
| Median | 26.6% | 13.4% |
| Interquartile 25% (IQ1) | 15.5% | 8.7% |
| Interquartile 75% (IQ3) | 50.0% | 20.6% |
| Interquartile Range (IQR) | 34.5% | 11.9% |
| Standard Deviation (Sample) | 29.3% | 13.7% |
| Standard Deviation (Population) | 28.6% | 13.4% |
Similar Demographics by Single Father Poverty
Demographics Similar to Shoshone by Single Father Poverty
In terms of single father poverty, the demographic groups most similar to Shoshone are Cajun (23.1%, a difference of 0.71%), Kiowa (22.5%, a difference of 2.0%), Native/Alaskan (22.4%, a difference of 2.3%), Tohono O'odham (22.0%, a difference of 4.1%), and Sioux (23.9%, a difference of 4.2%).
| Demographics | Rating | Rank | Single Father Poverty |
| Pueblo | 0.0 /100 | #328 | Tragic 21.1% |
| Colville | 0.0 /100 | #329 | Tragic 21.4% |
| Paiute | 0.0 /100 | #330 | Tragic 21.6% |
| Central American Indians | 0.0 /100 | #331 | Tragic 21.7% |
| Tohono O'odham | 0.0 /100 | #332 | Tragic 22.0% |
| Natives/Alaskans | 0.0 /100 | #333 | Tragic 22.4% |
| Kiowa | 0.0 /100 | #334 | Tragic 22.5% |
| Shoshone | 0.0 /100 | #335 | Tragic 22.9% |
| Cajuns | 0.0 /100 | #336 | Tragic 23.1% |
| Sioux | 0.0 /100 | #337 | Tragic 23.9% |
| Arapaho | 0.0 /100 | #338 | Tragic 24.0% |
| Apache | 0.0 /100 | #339 | Tragic 24.2% |
| Houma | 0.0 /100 | #340 | Tragic 26.7% |
| Hopi | 0.0 /100 | #341 | Tragic 27.2% |
| Yuman | 0.0 /100 | #342 | Tragic 28.4% |
Demographics Similar to Ugandans by Single Father Poverty
In terms of single father poverty, the demographic groups most similar to Ugandans are Immigrants from Costa Rica (16.3%, a difference of 0.010%), Guyanese (16.3%, a difference of 0.030%), Estonian (16.2%, a difference of 0.040%), Immigrants from Bangladesh (16.3%, a difference of 0.040%), and Immigrants from Europe (16.3%, a difference of 0.050%).
| Demographics | Rating | Rank | Single Father Poverty |
| Immigrants | Nicaragua | 67.8 /100 | #155 | Good 16.2% |
| Immigrants | Jordan | 66.0 /100 | #156 | Good 16.2% |
| Immigrants | Czechoslovakia | 62.8 /100 | #157 | Good 16.2% |
| Portuguese | 62.3 /100 | #158 | Good 16.2% |
| Belizeans | 59.9 /100 | #159 | Average 16.2% |
| Immigrants | Sudan | 59.8 /100 | #160 | Average 16.2% |
| Estonians | 56.7 /100 | #161 | Average 16.2% |
| Ugandans | 55.9 /100 | #162 | Average 16.3% |
| Immigrants | Costa Rica | 55.7 /100 | #163 | Average 16.3% |
| Guyanese | 55.2 /100 | #164 | Average 16.3% |
| Immigrants | Bangladesh | 55.1 /100 | #165 | Average 16.3% |
| Immigrants | Europe | 54.8 /100 | #166 | Average 16.3% |
| Yugoslavians | 53.9 /100 | #167 | Average 16.3% |
| Costa Ricans | 53.6 /100 | #168 | Average 16.3% |
| Northern Europeans | 52.8 /100 | #169 | Average 16.3% |