Shoshone vs Immigrants from Haiti Single Father Poverty
COMPARE
Shoshone
Immigrants from Haiti
Single Father Poverty
Single Father Poverty Comparison
Shoshone
Immigrants from Haiti
22.9%
SINGLE FATHER POVERTY
0.0/ 100
METRIC RATING
335th/ 347
METRIC RANK
17.2%
SINGLE FATHER POVERTY
0.8/ 100
METRIC RATING
256th/ 347
METRIC RANK
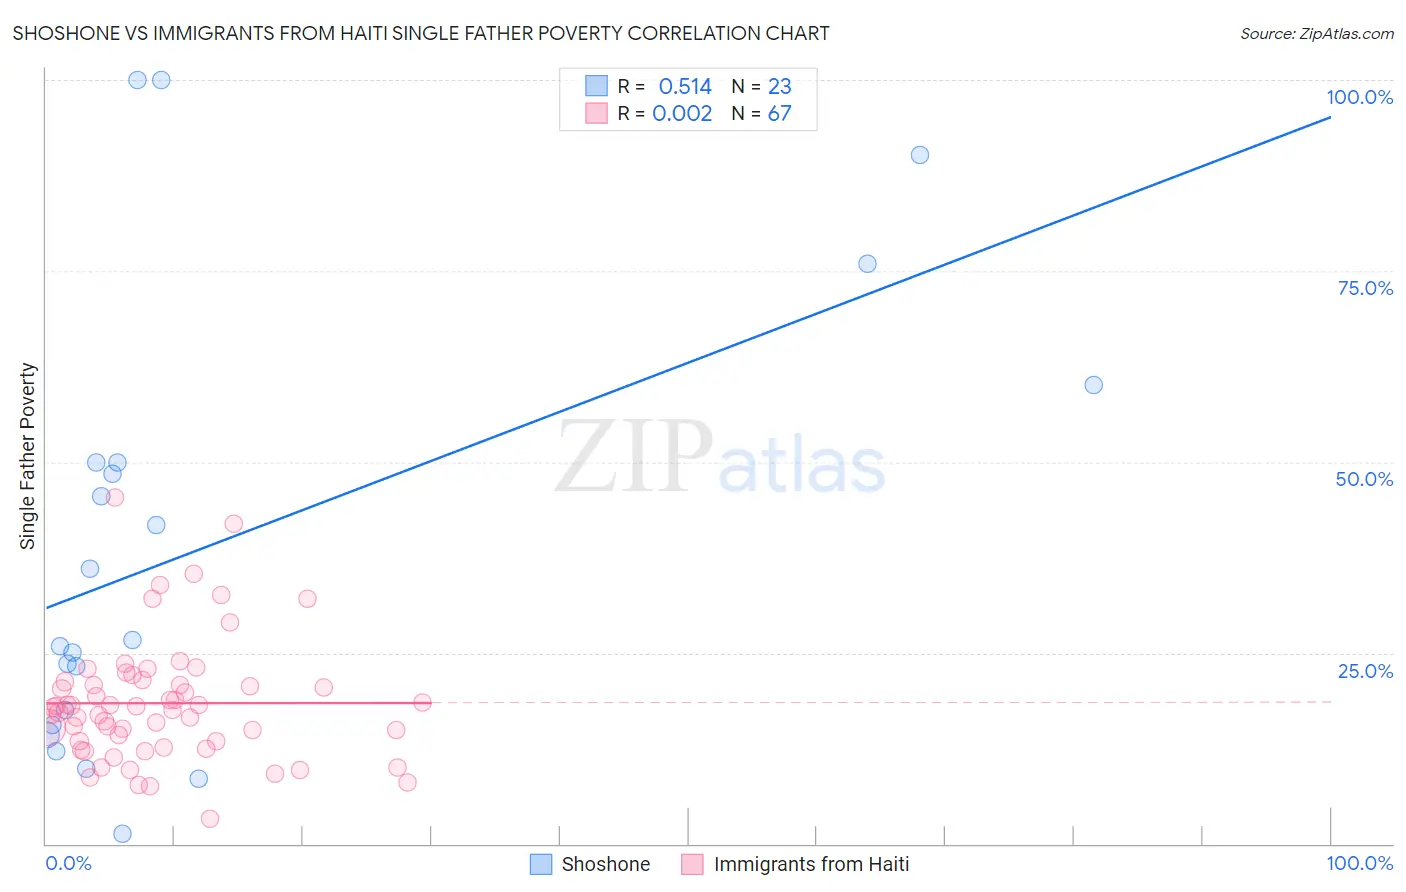
Shoshone vs Immigrants from Haiti Single Father Poverty Correlation Chart
The statistical analysis conducted on geographies consisting of 62,234,172 people shows a substantial positive correlation between the proportion of Shoshone and poverty level among single fathers in the United States with a correlation coefficient (R) of 0.514 and weighted average of 22.9%. Similarly, the statistical analysis conducted on geographies consisting of 189,968,112 people shows no correlation between the proportion of Immigrants from Haiti and poverty level among single fathers in the United States with a correlation coefficient (R) of 0.002 and weighted average of 17.2%, a difference of 33.4%.
Single Father Poverty Correlation Summary
| Measurement | Shoshone | Immigrants from Haiti |
| Minimum | 1.4% | 3.3% |
| Maximum | 100.0% | 45.4% |
| Range | 98.6% | 42.1% |
| Mean | 39.2% | 18.4% |
| Median | 26.6% | 17.8% |
| Interquartile 25% (IQ1) | 15.5% | 13.4% |
| Interquartile 75% (IQ3) | 50.0% | 21.2% |
| Interquartile Range (IQR) | 34.5% | 7.8% |
| Standard Deviation (Sample) | 29.3% | 7.9% |
| Standard Deviation (Population) | 28.6% | 7.8% |
Similar Demographics by Single Father Poverty
Demographics Similar to Shoshone by Single Father Poverty
In terms of single father poverty, the demographic groups most similar to Shoshone are Cajun (23.1%, a difference of 0.71%), Kiowa (22.5%, a difference of 2.0%), Native/Alaskan (22.4%, a difference of 2.3%), Tohono O'odham (22.0%, a difference of 4.1%), and Sioux (23.9%, a difference of 4.2%).
| Demographics | Rating | Rank | Single Father Poverty |
| Pueblo | 0.0 /100 | #328 | Tragic 21.1% |
| Colville | 0.0 /100 | #329 | Tragic 21.4% |
| Paiute | 0.0 /100 | #330 | Tragic 21.6% |
| Central American Indians | 0.0 /100 | #331 | Tragic 21.7% |
| Tohono O'odham | 0.0 /100 | #332 | Tragic 22.0% |
| Natives/Alaskans | 0.0 /100 | #333 | Tragic 22.4% |
| Kiowa | 0.0 /100 | #334 | Tragic 22.5% |
| Shoshone | 0.0 /100 | #335 | Tragic 22.9% |
| Cajuns | 0.0 /100 | #336 | Tragic 23.1% |
| Sioux | 0.0 /100 | #337 | Tragic 23.9% |
| Arapaho | 0.0 /100 | #338 | Tragic 24.0% |
| Apache | 0.0 /100 | #339 | Tragic 24.2% |
| Houma | 0.0 /100 | #340 | Tragic 26.7% |
| Hopi | 0.0 /100 | #341 | Tragic 27.2% |
| Yuman | 0.0 /100 | #342 | Tragic 28.4% |
Demographics Similar to Immigrants from Haiti by Single Father Poverty
In terms of single father poverty, the demographic groups most similar to Immigrants from Haiti are Sierra Leonean (17.2%, a difference of 0.010%), Immigrants from Albania (17.2%, a difference of 0.080%), Albanian (17.2%, a difference of 0.10%), Immigrants from Jamaica (17.2%, a difference of 0.13%), and Immigrants from Honduras (17.1%, a difference of 0.19%).
| Demographics | Rating | Rank | Single Father Poverty |
| Canadians | 1.3 /100 | #249 | Tragic 17.1% |
| Austrians | 1.1 /100 | #250 | Tragic 17.1% |
| Luxembourgers | 1.1 /100 | #251 | Tragic 17.1% |
| Croatians | 1.0 /100 | #252 | Tragic 17.1% |
| Cree | 1.0 /100 | #253 | Tragic 17.1% |
| Immigrants | Honduras | 0.9 /100 | #254 | Tragic 17.1% |
| Sierra Leoneans | 0.8 /100 | #255 | Tragic 17.2% |
| Immigrants | Haiti | 0.8 /100 | #256 | Tragic 17.2% |
| Immigrants | Albania | 0.7 /100 | #257 | Tragic 17.2% |
| Albanians | 0.7 /100 | #258 | Tragic 17.2% |
| Immigrants | Jamaica | 0.7 /100 | #259 | Tragic 17.2% |
| Spaniards | 0.6 /100 | #260 | Tragic 17.2% |
| Swiss | 0.5 /100 | #261 | Tragic 17.3% |
| Immigrants | Zaire | 0.4 /100 | #262 | Tragic 17.3% |
| Lithuanians | 0.4 /100 | #263 | Tragic 17.3% |