Czech vs Ugandan Single Father Poverty
COMPARE
Czech
Ugandan
Single Father Poverty
Single Father Poverty Comparison
Czechs
Ugandans
17.0%
SINGLE FATHER POVERTY
2.3/ 100
METRIC RATING
241st/ 347
METRIC RANK
16.3%
SINGLE FATHER POVERTY
55.9/ 100
METRIC RATING
162nd/ 347
METRIC RANK
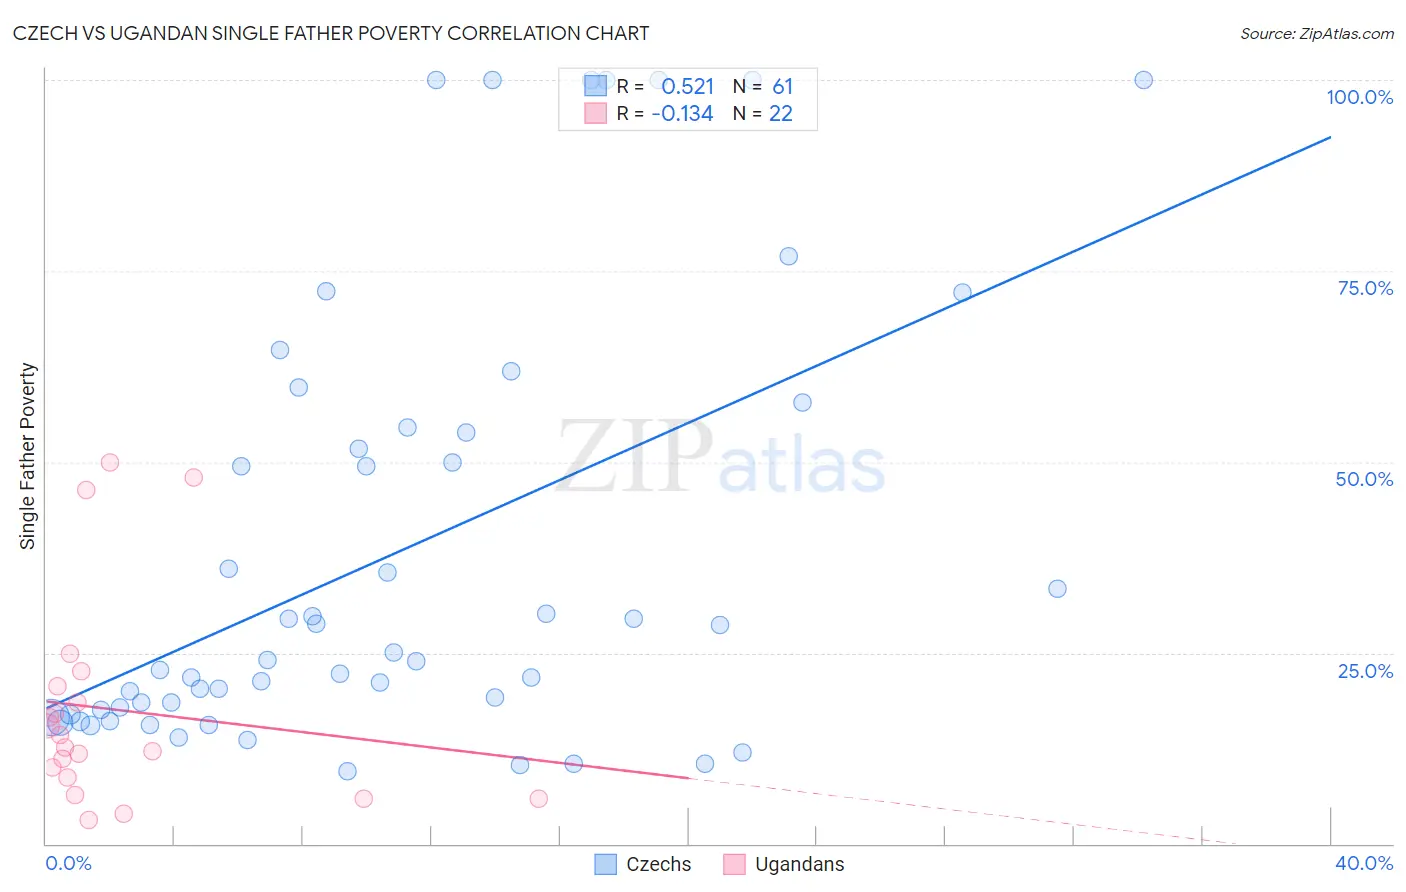
Czech vs Ugandan Single Father Poverty Correlation Chart
The statistical analysis conducted on geographies consisting of 358,801,462 people shows a substantial positive correlation between the proportion of Czechs and poverty level among single fathers in the United States with a correlation coefficient (R) of 0.521 and weighted average of 17.0%. Similarly, the statistical analysis conducted on geographies consisting of 87,224,974 people shows a poor negative correlation between the proportion of Ugandans and poverty level among single fathers in the United States with a correlation coefficient (R) of -0.134 and weighted average of 16.3%, a difference of 4.4%.
Single Father Poverty Correlation Summary
| Measurement | Czech | Ugandan |
| Minimum | 9.5% | 3.2% |
| Maximum | 100.0% | 50.0% |
| Range | 90.5% | 46.8% |
| Mean | 38.0% | 17.5% |
| Median | 24.1% | 13.4% |
| Interquartile 25% (IQ1) | 17.3% | 8.7% |
| Interquartile 75% (IQ3) | 54.2% | 20.6% |
| Interquartile Range (IQR) | 36.9% | 11.9% |
| Standard Deviation (Sample) | 28.4% | 13.7% |
| Standard Deviation (Population) | 28.2% | 13.4% |
Similar Demographics by Single Father Poverty
Demographics Similar to Czechs by Single Father Poverty
In terms of single father poverty, the demographic groups most similar to Czechs are Moroccan (17.0%, a difference of 0.10%), Finnish (16.9%, a difference of 0.12%), Bermudan (16.9%, a difference of 0.13%), Immigrants from Saudi Arabia (16.9%, a difference of 0.15%), and Subsaharan African (16.9%, a difference of 0.22%).
| Demographics | Rating | Rank | Single Father Poverty |
| Marshallese | 3.1 /100 | #234 | Tragic 16.9% |
| Immigrants | Western Europe | 2.9 /100 | #235 | Tragic 16.9% |
| Immigrants | Germany | 2.9 /100 | #236 | Tragic 16.9% |
| Sub-Saharan Africans | 2.9 /100 | #237 | Tragic 16.9% |
| Immigrants | Saudi Arabia | 2.7 /100 | #238 | Tragic 16.9% |
| Bermudans | 2.6 /100 | #239 | Tragic 16.9% |
| Finns | 2.6 /100 | #240 | Tragic 16.9% |
| Czechs | 2.3 /100 | #241 | Tragic 17.0% |
| Moroccans | 2.1 /100 | #242 | Tragic 17.0% |
| Immigrants | Cabo Verde | 1.6 /100 | #243 | Tragic 17.0% |
| Hondurans | 1.6 /100 | #244 | Tragic 17.0% |
| Trinidadians and Tobagonians | 1.5 /100 | #245 | Tragic 17.0% |
| Immigrants | Ireland | 1.4 /100 | #246 | Tragic 17.1% |
| Greeks | 1.3 /100 | #247 | Tragic 17.1% |
| Czechoslovakians | 1.3 /100 | #248 | Tragic 17.1% |
Demographics Similar to Ugandans by Single Father Poverty
In terms of single father poverty, the demographic groups most similar to Ugandans are Immigrants from Costa Rica (16.3%, a difference of 0.010%), Guyanese (16.3%, a difference of 0.030%), Estonian (16.2%, a difference of 0.040%), Immigrants from Bangladesh (16.3%, a difference of 0.040%), and Immigrants from Europe (16.3%, a difference of 0.050%).
| Demographics | Rating | Rank | Single Father Poverty |
| Immigrants | Nicaragua | 67.8 /100 | #155 | Good 16.2% |
| Immigrants | Jordan | 66.0 /100 | #156 | Good 16.2% |
| Immigrants | Czechoslovakia | 62.8 /100 | #157 | Good 16.2% |
| Portuguese | 62.3 /100 | #158 | Good 16.2% |
| Belizeans | 59.9 /100 | #159 | Average 16.2% |
| Immigrants | Sudan | 59.8 /100 | #160 | Average 16.2% |
| Estonians | 56.7 /100 | #161 | Average 16.2% |
| Ugandans | 55.9 /100 | #162 | Average 16.3% |
| Immigrants | Costa Rica | 55.7 /100 | #163 | Average 16.3% |
| Guyanese | 55.2 /100 | #164 | Average 16.3% |
| Immigrants | Bangladesh | 55.1 /100 | #165 | Average 16.3% |
| Immigrants | Europe | 54.8 /100 | #166 | Average 16.3% |
| Yugoslavians | 53.9 /100 | #167 | Average 16.3% |
| Costa Ricans | 53.6 /100 | #168 | Average 16.3% |
| Northern Europeans | 52.8 /100 | #169 | Average 16.3% |