Shoshone vs Ugandan Child Poverty Among Boys Under 16
COMPARE
Shoshone
Ugandan
Child Poverty Among Boys Under 16
Child Poverty Among Boys Under 16 Comparison
Shoshone
Ugandans
19.4%
CHILD POVERTY AMONG BOYS UNDER 16
0.2/ 100
METRIC RATING
260th/ 347
METRIC RANK
17.3%
CHILD POVERTY AMONG BOYS UNDER 16
12.5/ 100
METRIC RATING
204th/ 347
METRIC RANK
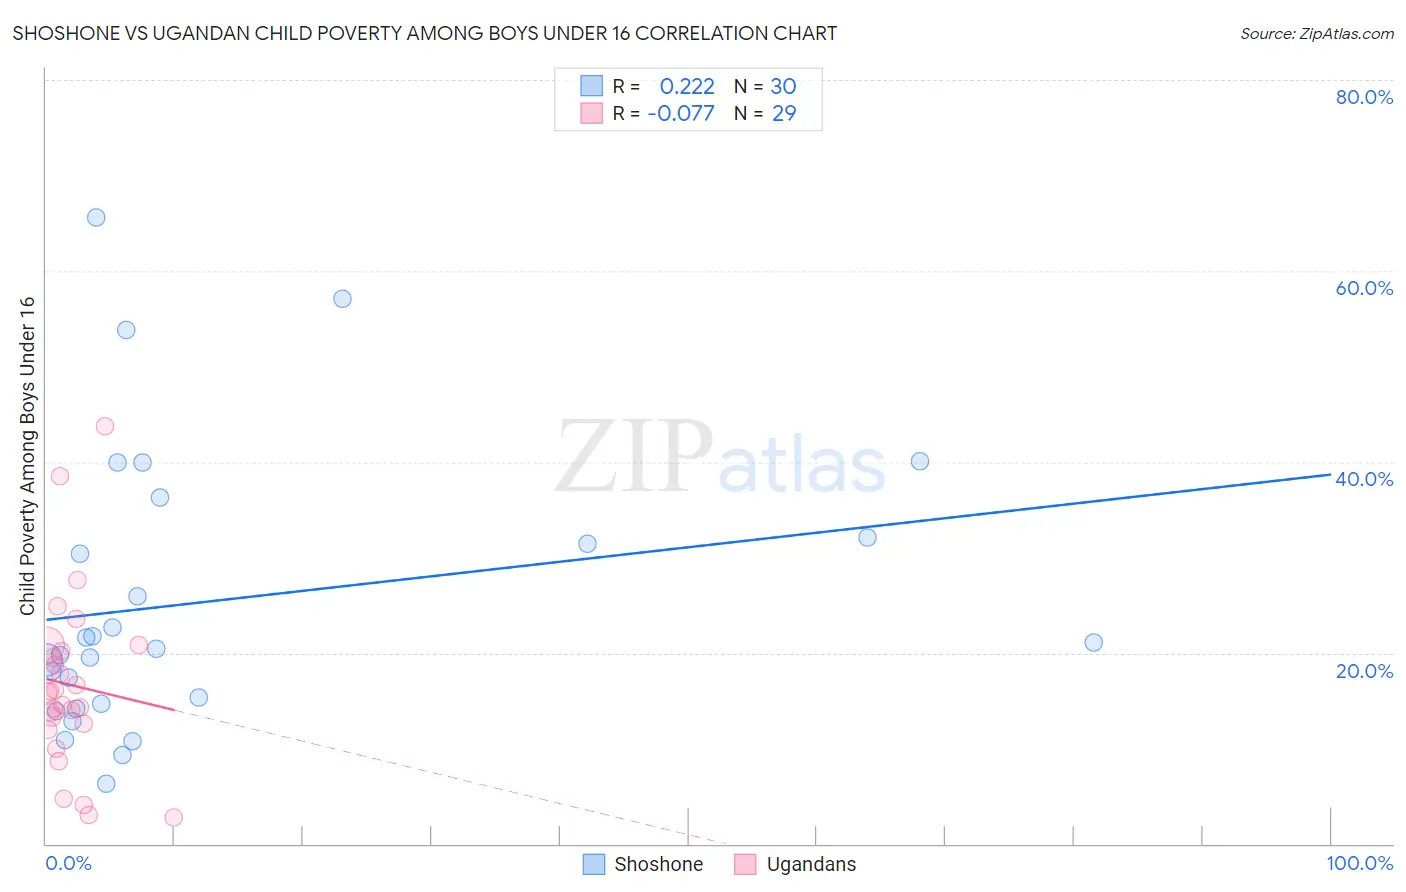
Shoshone vs Ugandan Child Poverty Among Boys Under 16 Correlation Chart
The statistical analysis conducted on geographies consisting of 66,418,613 people shows a weak positive correlation between the proportion of Shoshone and poverty level among boys under the age of 16 in the United States with a correlation coefficient (R) of 0.222 and weighted average of 19.4%. Similarly, the statistical analysis conducted on geographies consisting of 93,708,162 people shows a slight negative correlation between the proportion of Ugandans and poverty level among boys under the age of 16 in the United States with a correlation coefficient (R) of -0.077 and weighted average of 17.3%, a difference of 11.9%.
Child Poverty Among Boys Under 16 Correlation Summary
| Measurement | Shoshone | Ugandan |
| Minimum | 6.3% | 2.8% |
| Maximum | 65.6% | 43.7% |
| Range | 59.3% | 41.0% |
| Mean | 25.4% | 16.6% |
| Median | 20.8% | 15.8% |
| Interquartile 25% (IQ1) | 14.7% | 12.2% |
| Interquartile 75% (IQ3) | 32.0% | 20.5% |
| Interquartile Range (IQR) | 17.3% | 8.3% |
| Standard Deviation (Sample) | 14.7% | 9.2% |
| Standard Deviation (Population) | 14.5% | 9.1% |
Similar Demographics by Child Poverty Among Boys Under 16
Demographics Similar to Shoshone by Child Poverty Among Boys Under 16
In terms of child poverty among boys under 16, the demographic groups most similar to Shoshone are Immigrants from Ghana (19.4%, a difference of 0.010%), Spanish American (19.4%, a difference of 0.10%), Potawatomi (19.4%, a difference of 0.12%), Mexican American Indian (19.4%, a difference of 0.13%), and Immigrants from Liberia (19.3%, a difference of 0.34%).
| Demographics | Rating | Rank | Child Poverty Among Boys Under 16 |
| Liberians | 0.2 /100 | #253 | Tragic 19.3% |
| Trinidadians and Tobagonians | 0.2 /100 | #254 | Tragic 19.3% |
| Ecuadorians | 0.2 /100 | #255 | Tragic 19.3% |
| Immigrants | Liberia | 0.2 /100 | #256 | Tragic 19.3% |
| Mexican American Indians | 0.2 /100 | #257 | Tragic 19.4% |
| Potawatomi | 0.2 /100 | #258 | Tragic 19.4% |
| Spanish Americans | 0.2 /100 | #259 | Tragic 19.4% |
| Shoshone | 0.2 /100 | #260 | Tragic 19.4% |
| Immigrants | Ghana | 0.2 /100 | #261 | Tragic 19.4% |
| Immigrants | Guyana | 0.1 /100 | #262 | Tragic 19.5% |
| Ottawa | 0.1 /100 | #263 | Tragic 19.5% |
| Iroquois | 0.1 /100 | #264 | Tragic 19.6% |
| Guyanese | 0.1 /100 | #265 | Tragic 19.6% |
| Immigrants | El Salvador | 0.1 /100 | #266 | Tragic 19.6% |
| Vietnamese | 0.1 /100 | #267 | Tragic 19.6% |
Demographics Similar to Ugandans by Child Poverty Among Boys Under 16
In terms of child poverty among boys under 16, the demographic groups most similar to Ugandans are Immigrants from Uzbekistan (17.3%, a difference of 0.20%), Immigrants from Sierra Leone (17.3%, a difference of 0.22%), Immigrants from Afghanistan (17.3%, a difference of 0.28%), Immigrants from Portugal (17.4%, a difference of 0.33%), and German Russian (17.4%, a difference of 0.39%).
| Demographics | Rating | Rank | Child Poverty Among Boys Under 16 |
| Immigrants | Kenya | 20.1 /100 | #197 | Fair 17.1% |
| Immigrants | Cameroon | 19.0 /100 | #198 | Poor 17.1% |
| Delaware | 18.8 /100 | #199 | Poor 17.1% |
| Immigrants | Uruguay | 16.9 /100 | #200 | Poor 17.2% |
| Immigrants | Afghanistan | 13.7 /100 | #201 | Poor 17.3% |
| Immigrants | Sierra Leone | 13.4 /100 | #202 | Poor 17.3% |
| Immigrants | Uzbekistan | 13.3 /100 | #203 | Poor 17.3% |
| Ugandans | 12.5 /100 | #204 | Poor 17.3% |
| Immigrants | Portugal | 11.2 /100 | #205 | Poor 17.4% |
| German Russians | 10.9 /100 | #206 | Poor 17.4% |
| Immigrants | Thailand | 8.2 /100 | #207 | Tragic 17.5% |
| Malaysians | 7.6 /100 | #208 | Tragic 17.6% |
| Alaskan Athabascans | 7.3 /100 | #209 | Tragic 17.6% |
| Immigrants | Armenia | 6.8 /100 | #210 | Tragic 17.6% |
| Immigrants | Immigrants | 6.7 /100 | #211 | Tragic 17.6% |